INTRODUCTION
The genus Bythinella Moquin-Tandon, 1856, with its type species Bulimus viridis Poiret, 1801, is represented by more than 250 presently accepted nominal species (WoRMS 2021), belonging to the family Bythinellidae Locard, 1893. These are minute snails, whose shells are 2–3 mm high, mostly inhabiting European springs. Their range runs from Pyrenees to western Asia Minor and from southern Poland to the southernmost parts of Europe. The shells of Bythinella are ovate in outline, the snails are dioecious, the fertilisation is internal, there is a bi-armed penis, whose one arm harbours the terminal part of the vas deferens, and the second one, flagellum, the outlet of the long tubular gland. The eggs are laid in capsules attached to the stones, all through the year (Szarowska 1996). Bythinella is rather oligostenothermic and inhabits mainly waters rich in calcium. With a taenioglossate radula they take detritus and algae from the substrate. These snails inhabit springs but can also be found in subterranean waters (occasionally as pigment- and eyeless individuals), and exceptionally in the upper parts of streams and in marshy areas or even in bogs.
Their shells have been collected and studied since about 1840. The shells are simple, smooth, but occasionally with keel(s). Shell shape ranges from globular to elongated, without any more prominent sculpture. The aperture is simple, lacking any characteristic features, but is widely variable, and the variation is presumed to be ecophenotypic. Patterns of this morphological variation were interpreted on the assumption that the springs are biotopes isolated and long lasting (the latter is not true: Szarowska 2000), thus potentially inhabited by endemic species. This assumption resulted in multiple descriptions of new species at most newly studied springs, resulting in more than 250 nominal species of Bythinella being recognised; most of these species were in need of revision.
At the beginning of twentieth century there was growing acceptance that the shell, sometimes also the radula, was not sufficient as the basis for gastropod taxonomy, especially at the species level. Following the classical studies of Roszkowski (1914) on the Lymnaeidae of Lac Leman, anatomy as the basis for species determination became a rule (Hubendick 1951). There was also growing knowledge of the anatomy of the Caenogastropoda (Bregenzer 1916, Krull 1935, Johansson 1939, 1948, Lilly 1953), perfectly summarised by Fretter & Graham (1994). The “key-and-lock” concept, popular especially in entomology (Masly 2012), resulted in detailed studies and descriptions of the morphology of copulatory organs and the whole reproductive system. The head pigmentation and penis morphology made possible species identification in brackish water truncatelloid Hydrobiidae (Muus 1963, 1967). Detailed description and morphometry of numerous details of morphology and anatomy of the soft parts, as the basis for phenetic taxonomy of the Hydrobiidae, were introduced by George M. Davis and his co-workers (e.g., Davis 1966, 1967, Hershler & Davis 1980, Davis et al. 1982, Davis & Pons da Silva 1984). Hershler & Ponder (1998) published the list of characters and their states to be considered by hydrobioid specialists, following the arrangements accepted during the Hydrobioid Workshop (Eleventh International Malacological Congress, Siena 1992).
However, perfectly fixed material is required for such detailed morphological and morphometric studies. These are time-consuming and there is not enough material to examine the range of variability across the hydrobioids; this is much greater than previously expected (Giusti & Pezzoli 1977, 1980, Falniowski 1987a, 1992, Mazan 2000).
In the taxonomy of the genus Bythinella, the shell, the habitus of the penis together with the tubular gland, as well as renal (in the form of thickened loop) and pallial (especially bursa copulatrix and receptaculum seminis) section of the female reproductive organs were considered (Jungbluth 1972, Boeters 1973, 1981, Radoman 1973, 1976, 1983, 1985, Giusti & Pezzoli 1977, 1980, Jungbluth & Boeters 1977, Falniowski 1980, 1987b, 1987c, Glöer 2002, Glöer & Pešić 2006, 2010, 2014, Boeters & Falkner 2008, Falniowski et al. 2009a, Glöer & Georgiev 2009). It must be noted, however, that the data obtained could be subject to multiple interpretations. Giusti & Pezzoli (1977, 1980) considered the variation of morphology and anatomy of the soft parts as so wide and so continuous that there is no way to distinguish species and rather a superspecies concept should be applied. For Radoman (1983) there should be no anatomical differences between the phylogenetically close congeneric species. Falniowski (1987a, 1992) demonstrated wide variability of all the characters, which made the species identification uneasy, but still possible, after careful examination of small differences and overlapping ranges of morphological variability. Falniowski’s results (1987a, 1992) contradict Boeters’ (1973, 1981, 1998) delimitation hypotheses, based in particular on the shape of the bursa copulatrix.
Thus, species delimitation in the genus Bythinella remains unclear on the basis of anatomical characters alone. The diversity pattern presented a picture typical of morphostatic evolution, as defined by Davis (1992), non-adaptive radiation – rapid proliferation of species which do not differ in ecology (Gittenberger 1991). Non-adaptive radiation is usually correlated with the lack of niche differentiation, limited ranges of phenotypic variability and most often allopatric evolution. Bythinella seems to fulfil these conditions. Thus, there is formed a flock of closely related species, diverse neither morphologically nor ecologically, sometimes as a result of sympatric speciation (Gittenberger 1988). Such non-adaptive radiation causing morphostatic evolution seems not uncommon in gastropods (e.g., Cameron 1992, Cameron et al. 1996, Falniowski et al. 2012a, 2020). Allozyme studies on Bythinella (Szarowska et al. 1998, Falniowski et al. 1998, 1999, Mazan & Szarowska 2000a, 2000b) did not help in unambiguous species distinction. Both morphology and allozymes often provided results in a “grey-zone” – already a distinct species or still not?
Thus, DNA sequences – mostly cytochrome c oxidase subunit I (COI), whose usefulness in species distinction within the Truncatelloidea had been demonstrated (e.g., Spolsky et al. 1996, Davis et al. 1998) – promised a solution, remembering that even properly reconstructed phylogeny of a gene need not necessarily be identical with the phylogeny of a species (e.g., Avise 2000). From among the studies on the phylogeny, phylogeography and speciation in Bythinella we can list: Szarowska & Wilke (2004), Bichain et al. (2007a, 2007b), Haase et al. (2007), Benke et al. (2009, 2011), Falniowski et al. (2009b, 2009c, 2012b, 2016), Wilke et al. (2010), Falniowski & Szarowska (2011, 2012), Fehér et al. (2013), Osikowski et al. (2015), Szarowska et al. (2016a). Some of these reconstructed relationships and the distinctness of particular species (like Szarowska & Wilke 2004, Haase et al. 2007, Falniowski et al. 2009c, 2016, Fehér et al. 2013). Bichain et al. (2007a, 2007b) studied French Bythinella, trying to establish, with numerical methods, the border line between the species, quantified in genetic p-distance. Benke et al. (2009, 2011) studied Bythinella from Central and Western Europe, trying to reconstruct its possible glacial refugia by analysing COI sequences. Wilke et al. (2010) tried to summarise the data on the evolutionary processes in Bythinella. The genetic studies on the intra- and interpopulation diversity covered Romania (Falniowski et al. 2009b), continental Greece (Falniowski & Szarowska 2011), Bulgaria (Osikowski et al. 2015) and the Aegean Islands (Szarowska et al. 2016a).
About 15 years after the first sequence of COI in Bythinella appeared in GenBank, it is now among the best represented genus in terms of number of sequences available. However, these studies do not cover all the geographic range of the genus, and the microevolutionary processes are still unclear. There is no consensus concerning the criteria for species distinction, and thus the systematics on the species level remains unclear. Only a few populations from Central Europe were studied, and even fewer from the Western Balkans.
The aim of the present study is to fill this gap. It deals with populations from this area not studied so far. Phylogeographic and phylogenetic analysis of COI also includes all the sequences available in GenBank. While species delimitation should be based mainly on COI, as it is the basic marker used in animal barcoding, and its diversity is most suitable for species delimitation, the deeper relationships cannot be reconstructed with COI, since the radiation took part too long ago. Thus, it is also necessary to check the phylogeny revealed by nuclear genes, although their divergence level is too small to distinguish species. Such analyses allow us, for example, to exclude errors caused by hybridisation and introgression, so beside the COI, five nuclear fragments have been also sequenced to attempt to determine evolution within the genus and species-level diversification.
MATERIAL AND METHODS
MATERIAL COLLECTION
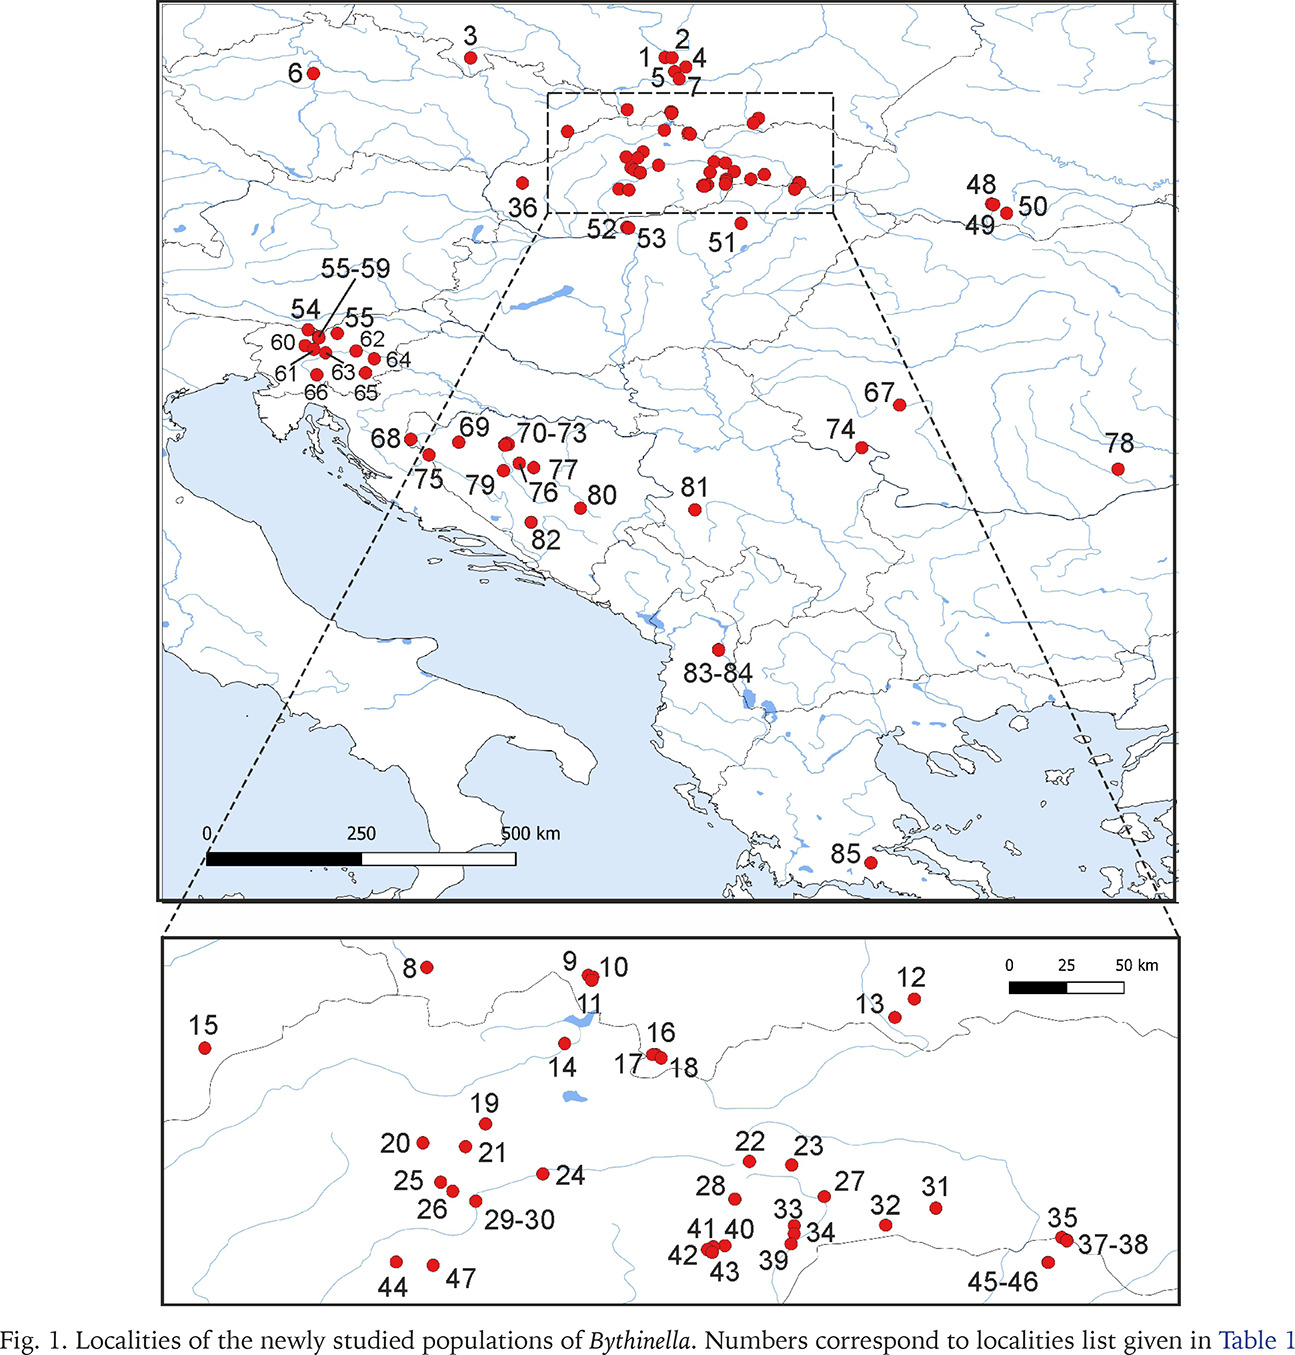
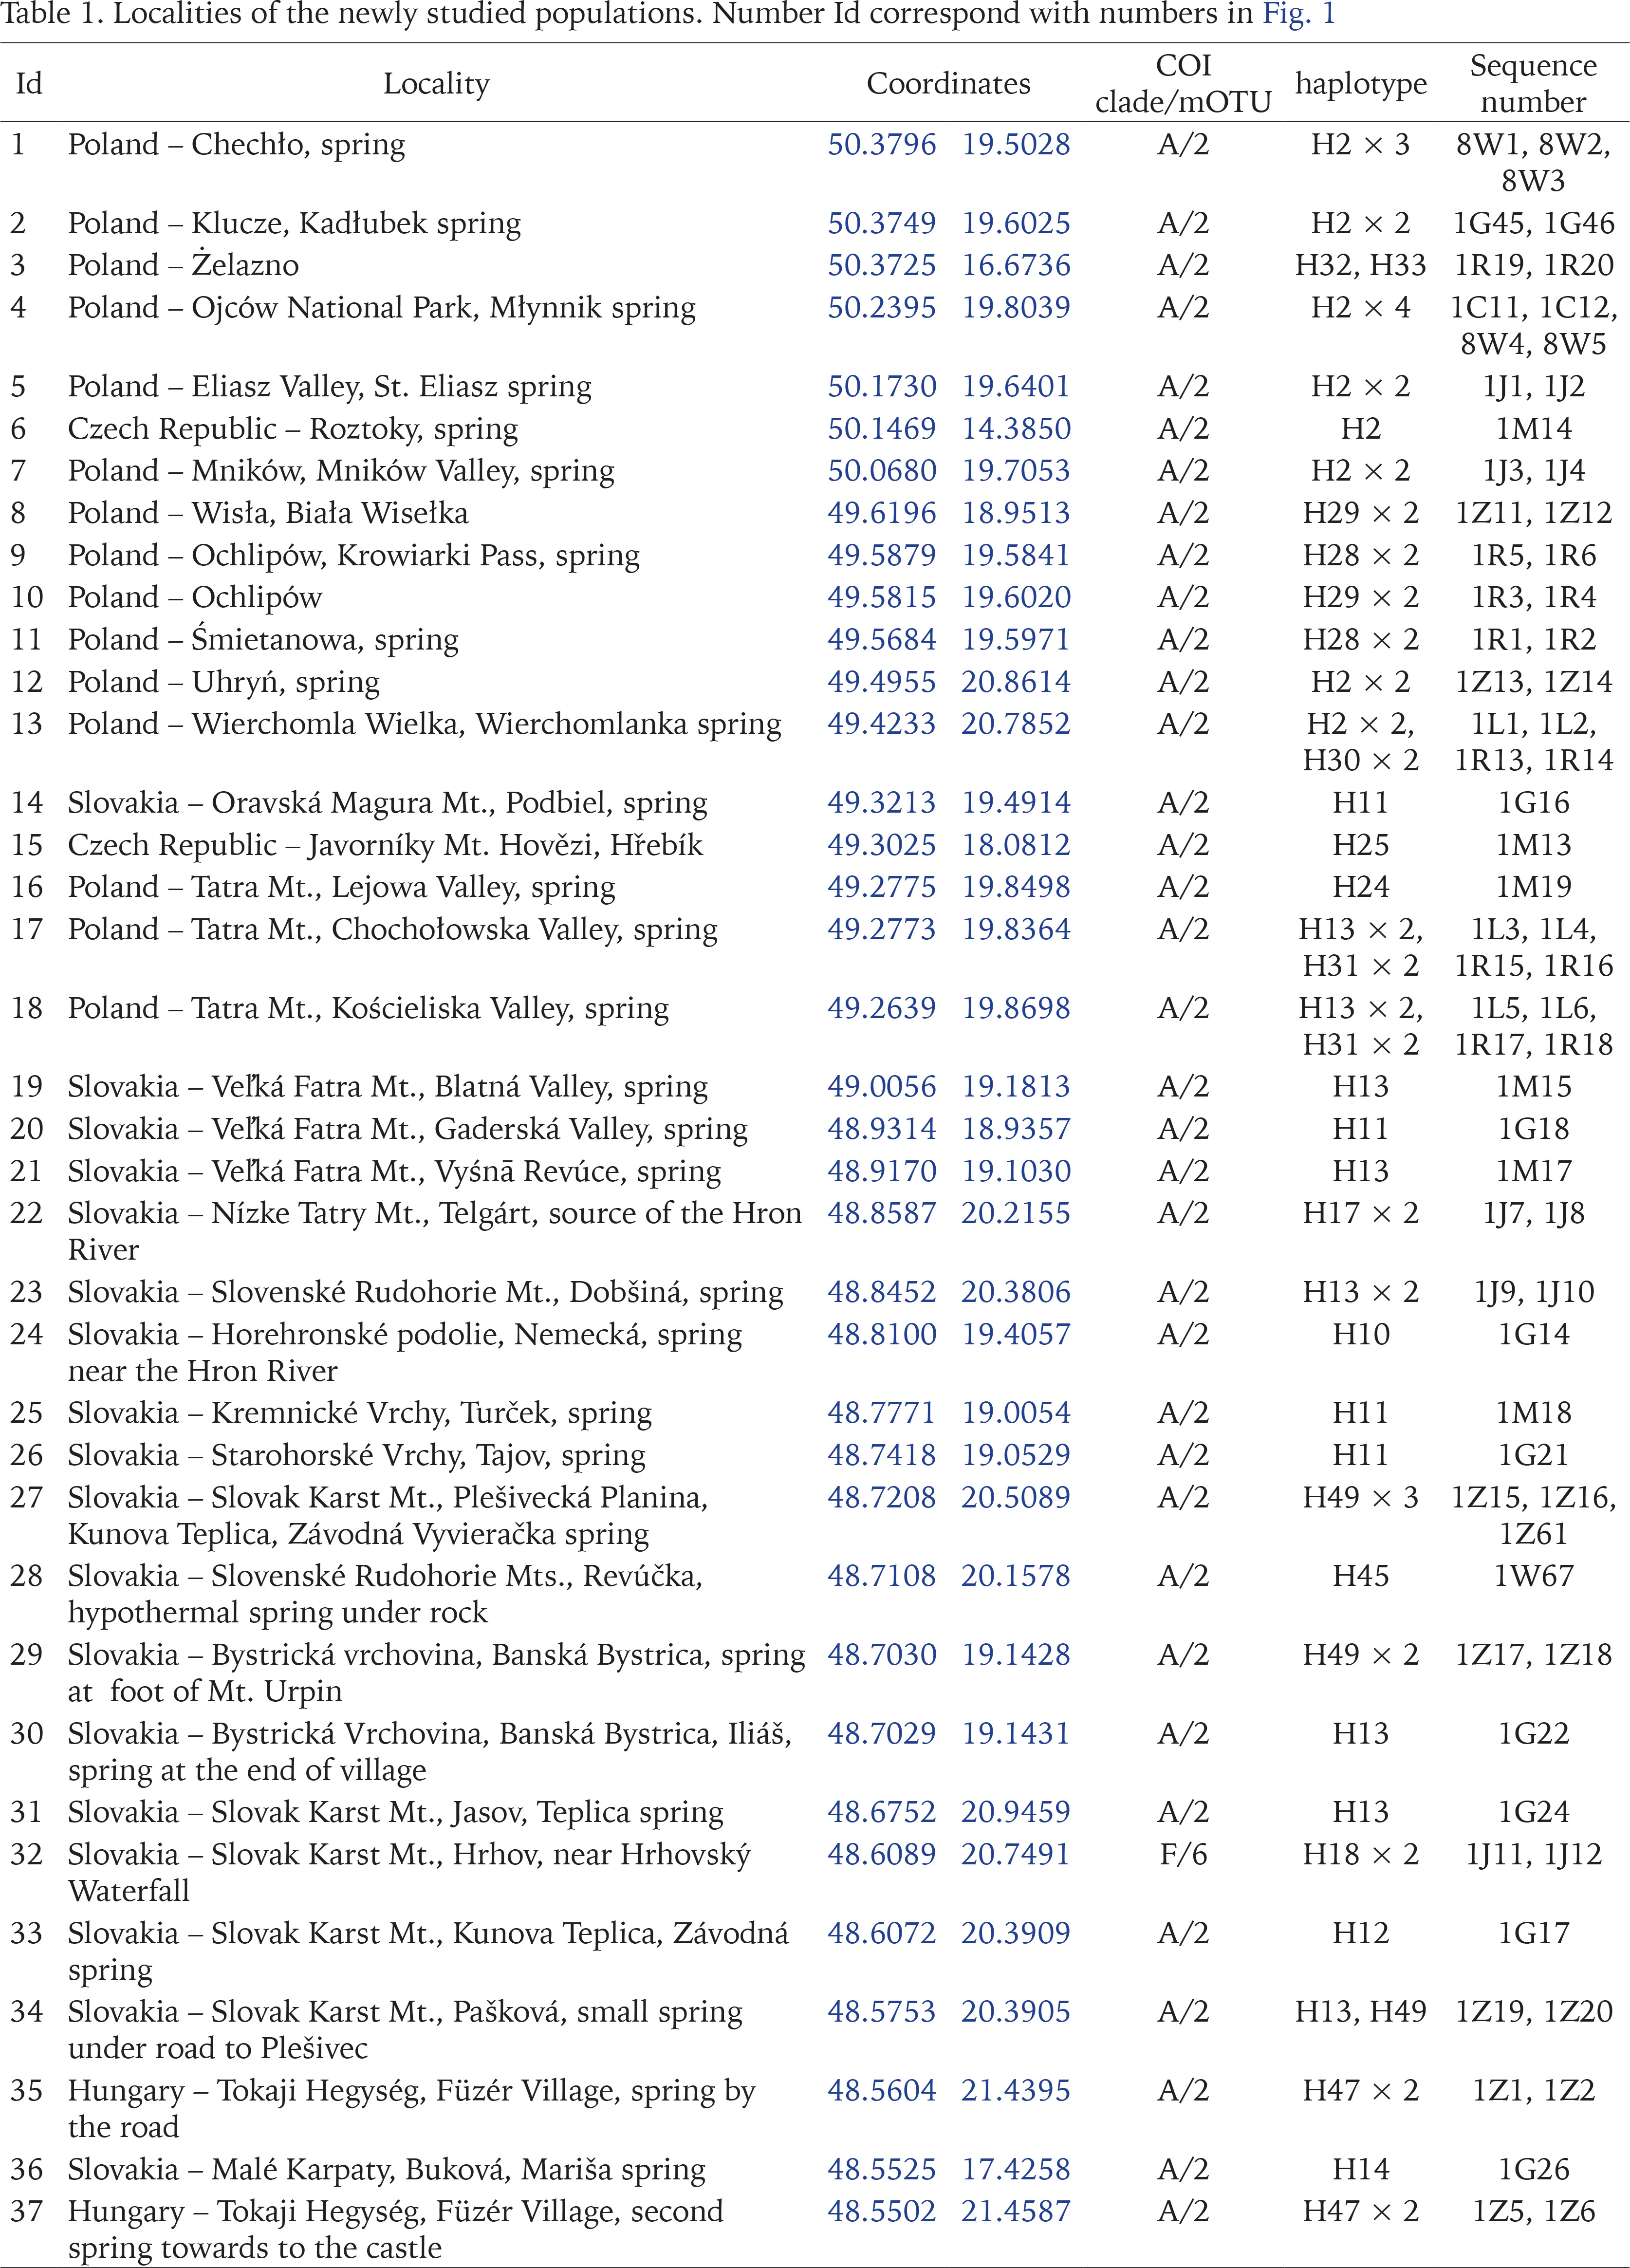
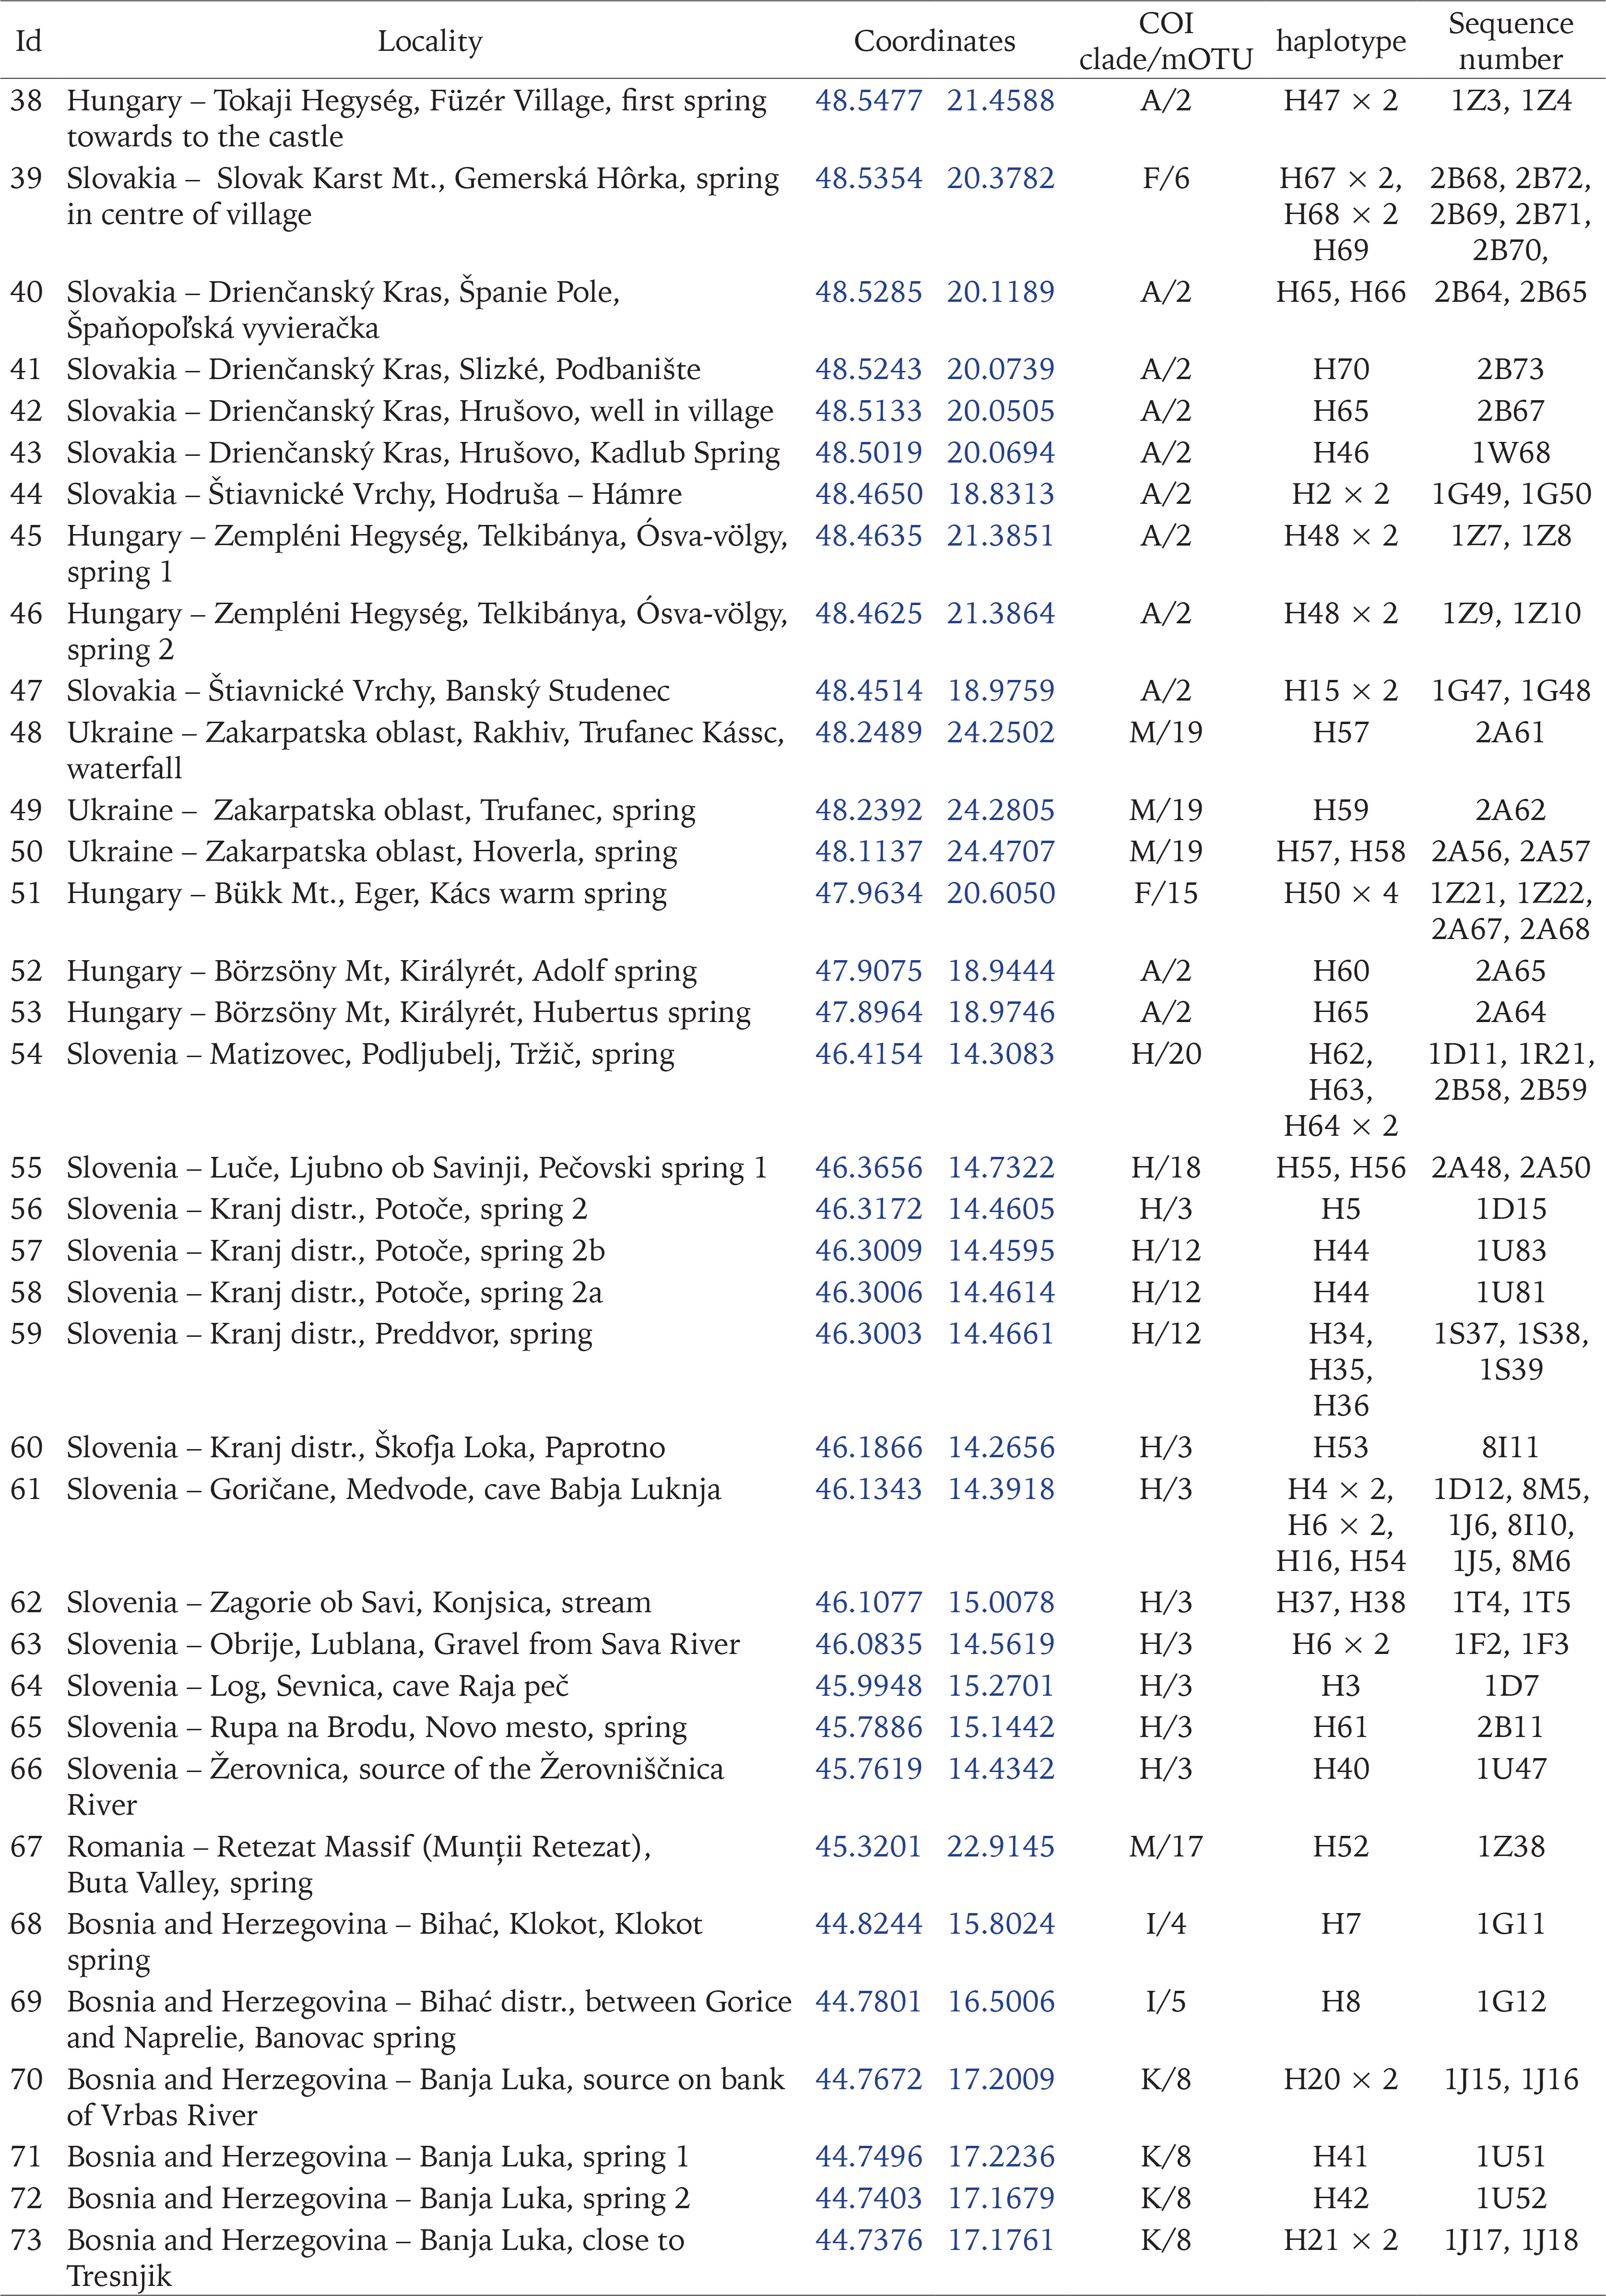
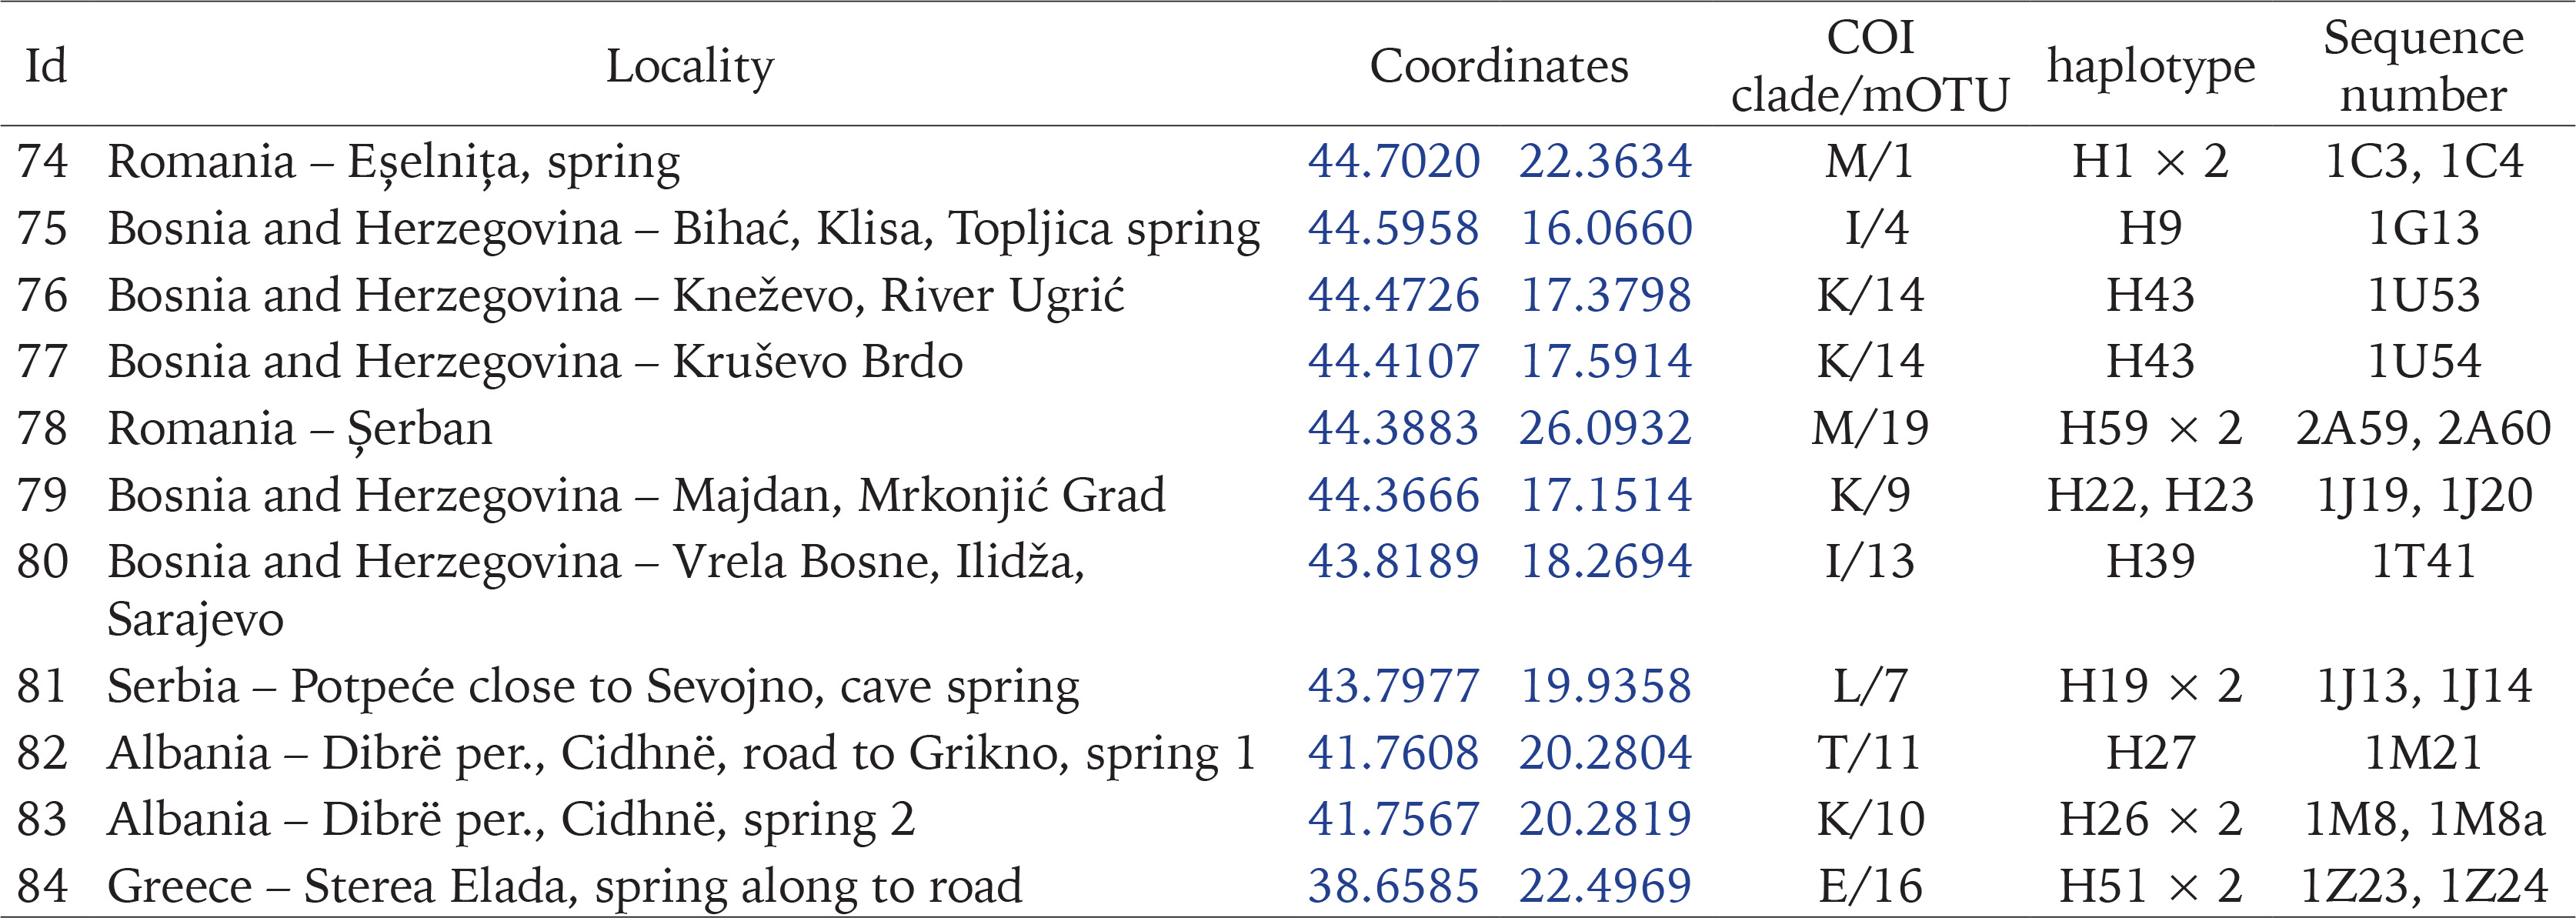
The snails were collected between 2015 and 2020. They were taken by hand from stones, gravel and fallen leaves, or with a sieve 500 μm coarse, mostly from springs, some from the subterranean waters – caves, wells, and interstitial gravels. 84 localities in Central and Southern Europe were sampled (Figs 1–11, Table 1): 25 from Slovakia, 15 from Poland, 13 from Slovenia, 11 from Bosnia and Herzegovina, 8 from Hungary, 3 from Ukraine, 3 from Romania, 2 from Albania, 2 from Czech Republic, 1 from Greece and 1 from Serbia. The snails were fixed in 80% analytically pure ethanol, replaced twice. Next, the snails were put in fresh 80% analytically pure ethanol and stored at −20 °C temperature in a refrigerator.
Fig. 1
Localities of the newly studied populations of Bythinella. Numbers correspond to localities list given in Table 1
Figs 2–10
Some of the studied localities: 2 – locality 4; 3 – locality 5; 4 – locality 7; 5 – locality 12; 6 – locality 22; 7 – locality 32; 8 – locality 61; 9 – locality 62; 10 – locality 47
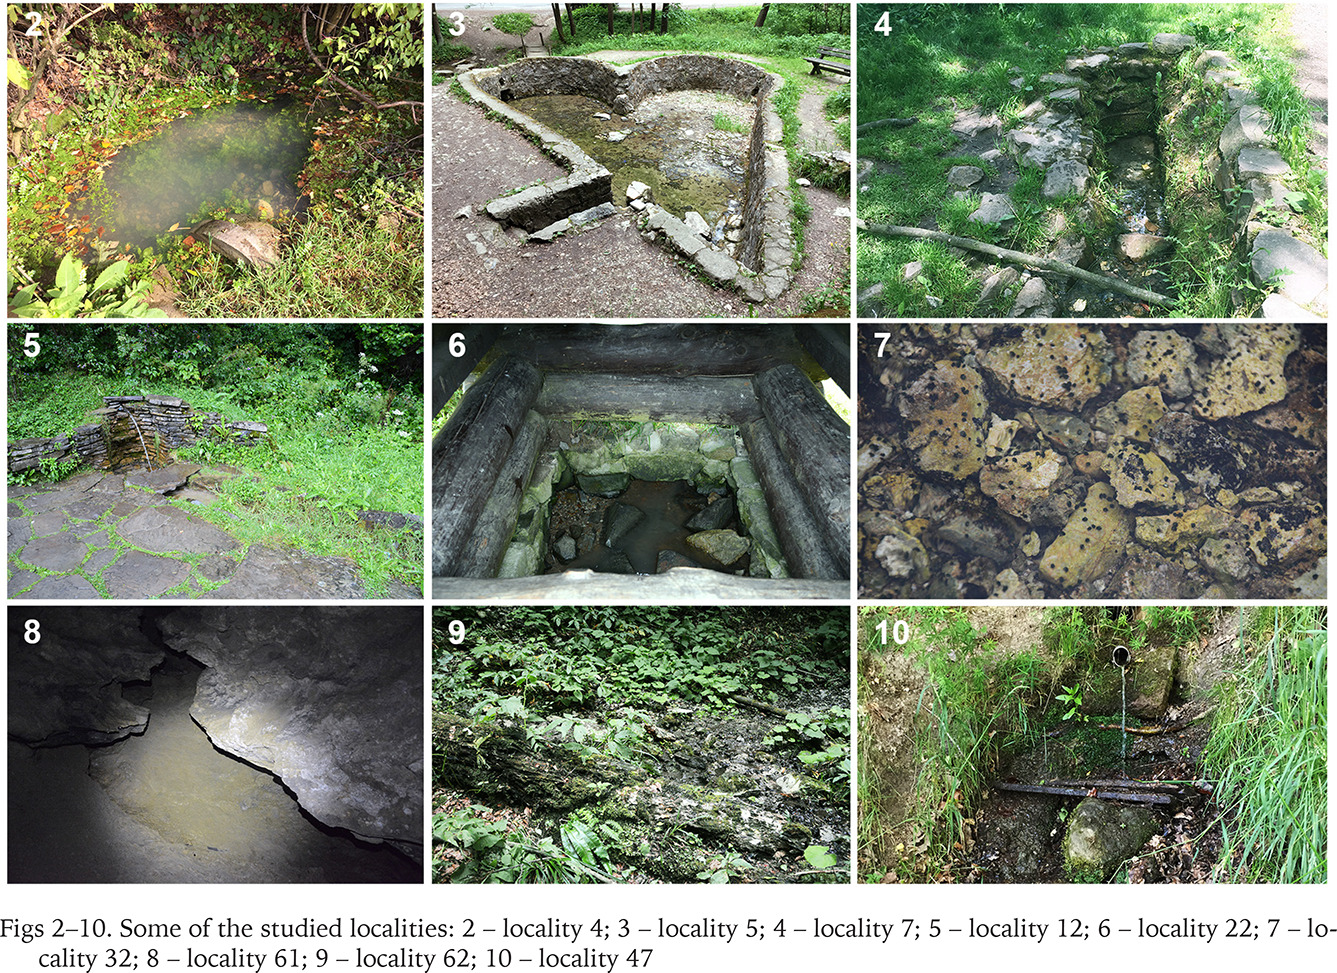
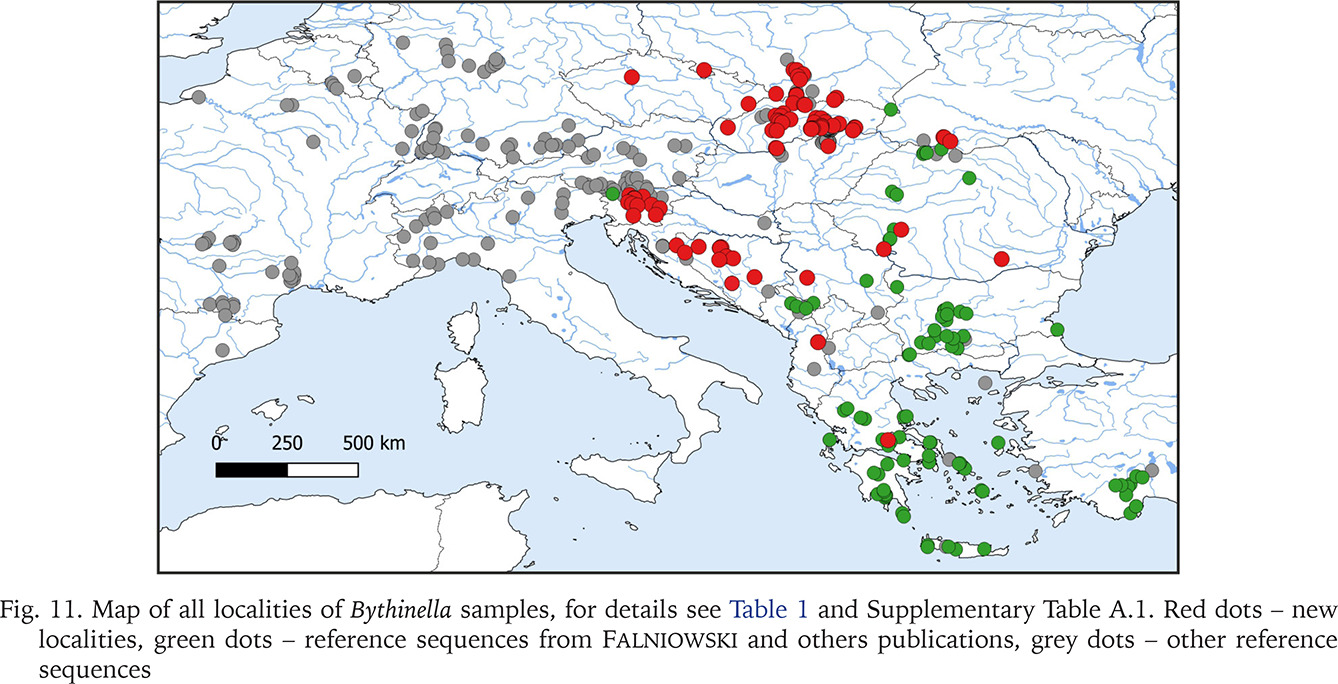
Fig. 11
Map of all localities of Bythinella samples, for details see Table 1 and Supplementary Table A.1. Red dots – new localities, green dots – reference sequences from Falniowski and others publications, grey dots – other reference sequences
MORPHOLOGICAL STUDIES
The shells were photographed with a Canon EOS 50D digital camera, under a Nikon SMZ18 microscope with dark field. Morphometric parameters of the shell (Fig. 12, Table 2) were measured by one person using Nikon DS-5 digital camera and ImageJ image analysis software (Rueden et al. 2017). The linear measurements were then logarithmically transformed; for angular measurements, the arcsine transformation was applied. Principal component analysis (PCA), based on the matrix of correlation, was computed, applying a descriptive, non-stochastic approach. The original observations were projected into PC space, to show relationships between the specimens, without any classification given a priori. For PCA analysis ClustVis 2.0 web tool (Metsalu & Vilo 2015) was used. The dissections were done under Nikon SMZ18 microscope with dark field, the structures were photographed with either Canon EOS 50D digital camera or Nikon DS-5 digital camera, and later the drawings of the female reproductive organs were drawn basing on these photographs. The techniques used for the SEM study of the radulae were as described by Falniowski (1990). The radulae were photographed with HITACHI-S-4700 scanning electron microscope.
Fig. 12
Shell measurements: a – shell height; b – body whorl breadth; c – aperture height; d – spire height; e – aperture breadth; α – apex angle measured between the lines tangential to the spire; β – angle between the body whorl suture and the line perpendicular to the columella
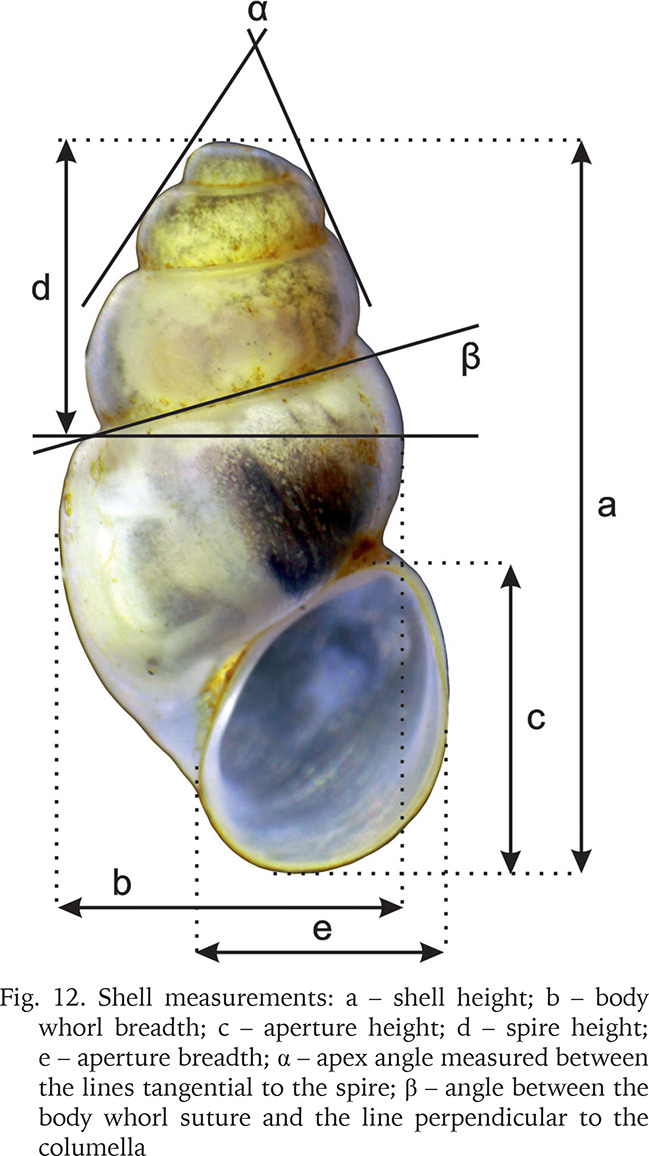
Table 2
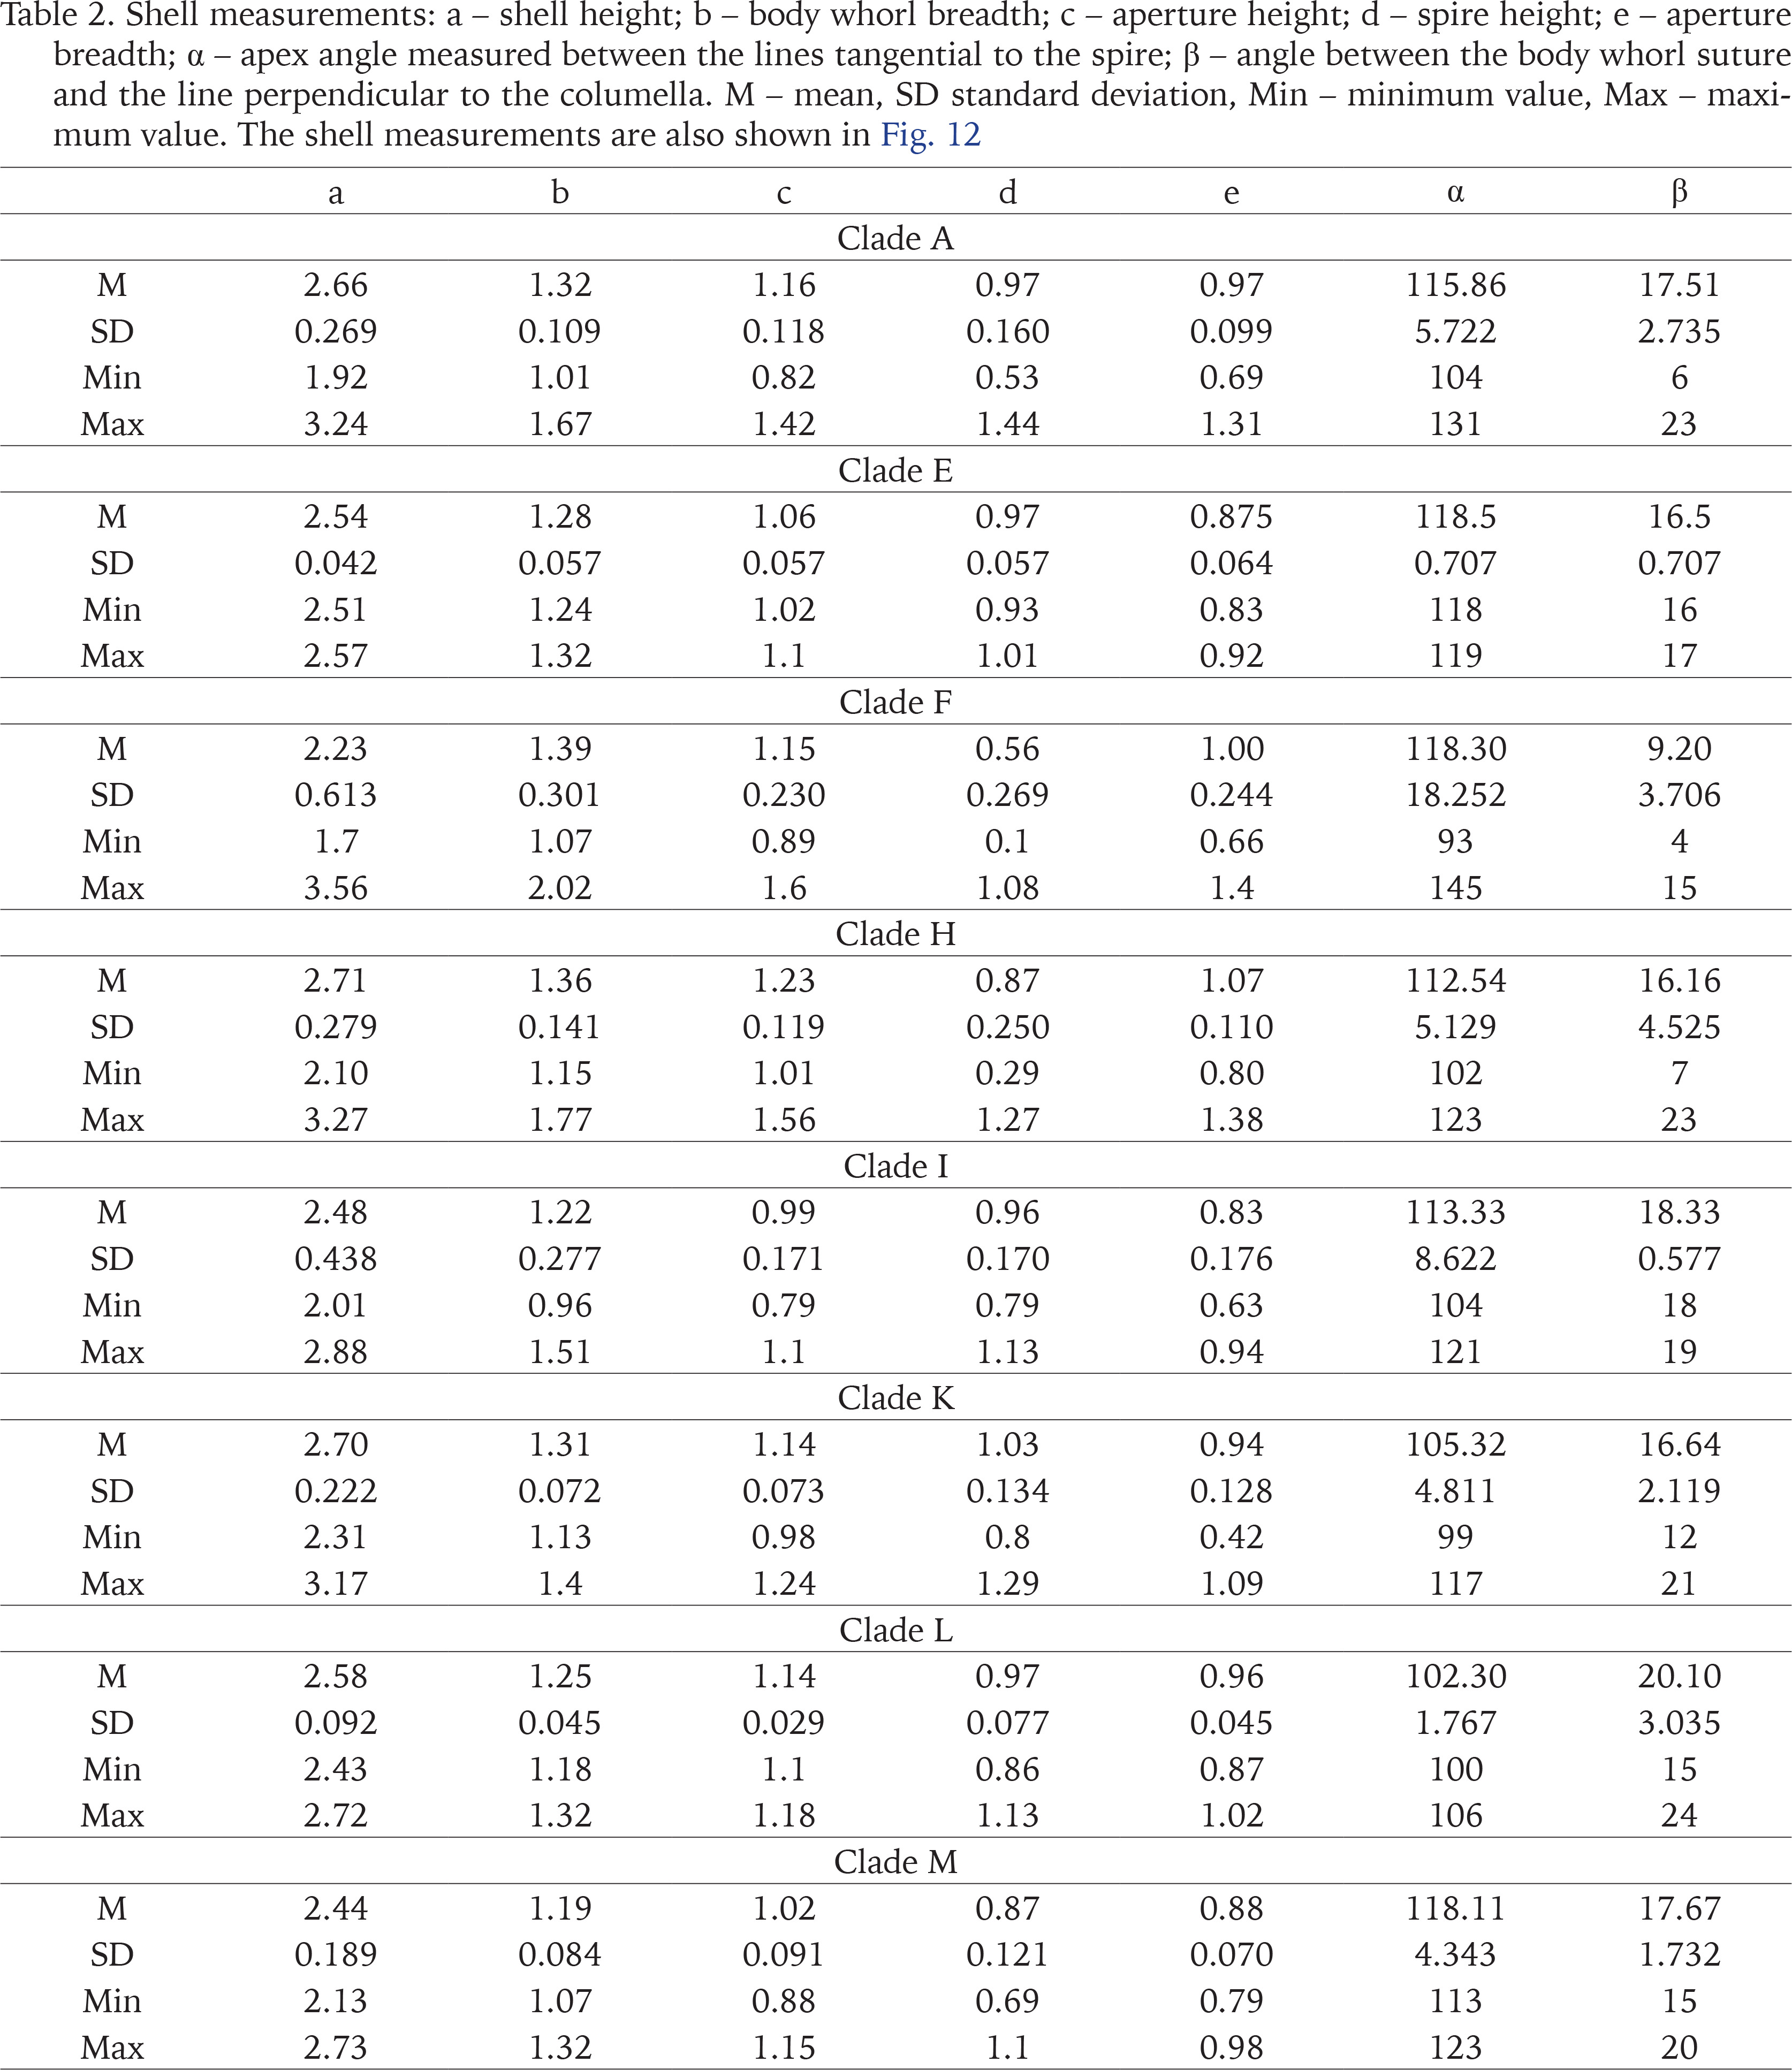
Shell measurements: a – shell height; b – body whorl breadth; c – aperture height; d – spire height; e – aperture breadth; α – apex angle measured between the lines tangential to the spire; β – angle between the body whorl suture and the line perpendicular to the columella. M – mean, SD standard deviation, Min – minimum value, Max – maximum value. The shell measurements are also shown in Fig. 12
DNA EXTRACTION AND SEQUENCING
For molecular study, the tissue was hydrated in tris-EDTA (TE) buffer (3 × 10 min); then total genomic DNA was extracted with the SHERLOCK extracting kit (A&A Biotechnology), and the final product was dissolved in 20 μl TE buffer. The extracted DNA was stored at −80 °C at the Department of Malacology, Institute of Zoology and Biomedical Research, Jagiellonian University in Kraków (Poland).
Mitochondrial cytochrome c oxidase subunit I (COI) and nuclear histone 3 (H3), ribosomal Internal Transcribed Spacer 1 (ITS-1), ribosomal Internal Transcribed Spacer 2 (ITS-2), 18S ribosomal RNA (18S) and 28S ribosomal RNA (28S) loci were sequenced. Details of PCR conditions, primers used, and sequencing were given in Folmer et al. (1994), Almeyda-Artigas et al. (2000), Osikowski et al. (2015), Szarowska et al. (2016b), Hofman et al. (2022a, 2022b). The PCR products were purified using Exo-Sap procedure, and then were amplified using BigDye Terminator v3.1 (Applied Biosystems). The sequencing reaction products were purified using ExTerminator Columns (A&A Biotechnology); DNA fragments then underwent electrophoresis on and 3730xl DNA Analyzer (Genomed, Warsaw, Poland).
ANALYSIS OF MOLECULAR DATA
Sequences were initially aligned in the MUSCLE (Edgar 2004) program in MEGA 7 (Kumar et al. 2016) and then checked in BIOEDIT 7.1.3.0 (Hall 1999). The hypervariable fragments, especially for ITS, were removed before analysis. The saturation test (Xia 2000, Xia et al. 2003) was performed using DAMBE (Xia 2018). In the phylogenetic analysis additional sequences from GenBank were used (Supplementary Table A.1). In total, 1,437 COI sequences of Bythinella, from 401 populations scattered throughout Europe, were analysed. For the nuclear markers, 92 specimens were analysed. The data were analysed using approaches based on Bayesian inference (BI) and maximum likelihood (ML). For ML analysis, the jModelTest2 via the CIPRES Science Gateway (Miller et al. 2010) was used to find the best-fitting model for each gene. For COI sequences, the model TIM3+I+G was used, for H3 F81 one. The ML analysis was conducted in RAxML-NG v. 0.8.0 (Kozlov et al. 2019), with 10 random and 10 parsimony starting trees. In the BI analysis, the GTR+I+G model of nucleotide substitution was applied in tree reconstruction for COI. Models were selected using MrModelTest 2.4 (Nylander 2004). The Bayesian analyses were run using MrBayes v. 3.2.3 (Ronquist et al. 2012) with defaults of most priors. Two simultaneous analyses were performed, each with 10,000,000 generations, with one cold chain and three heated chains, starting from random trees and sampling the trees every 1,000 generations. The first 25% of the trees were discarded as burn-in. The analyses were summarised as a 50% majority-rule tree (Rambaut 2010). Convergence was checked in Tracer v. 1.5 (Rambaut & Drummond 2009).
Three species delimitation methods were performed: Poisson Tree Processes (PTP) (Zhang et al. 2013), Automatic Barcode Gap Discovery (ABGD) (Puillandre et al. 2011) and and Assemble Species by Automatic Partitioning (ASAP) (Puillandre et al. 2021). The PTP approach was run using the web server (https://species.h-its.org/ptp/), with 100,000 MCMC generations, 100 thinning and 0.1 burn-in. RAxML output phylogenetic tree was used (Stamatakis 2014). The ABGD approach using the web server (https://bioinfo.mnhn.fr/abi/public/abgd/abgdweb.html) and the default parameters was run. The ASAP approach was run using the web server (https://bioinfo.mnhn.fr/abi/public/asap/), according to simple distance (p-distances). For general species delimitation ABGD and ASAP were used; these two methods, giving identical results, seem to best reflect the variability and phylogeny of the obtained sequences. To infer haplotype networks of markers, we used a median-joining calculation implemented in NETWORK4 (Bandelt et al. 1999). For all the Bythinella clades and species, we compared the amounts of variation, measured as nucleotide diversity (π), haplotype diversity (Hd) and the number of segregating sites (S), present in these groups. The parameters were calculated with DnaSP software (Librado & Rozas 2009). We also computed the statistics commonly used to test for demographic expansions (Tajima’s D, Fu’s Fs) using Arlequin version 3.5 (Excoffier & Lischer 2010). The same program was used to analyze molecular variance (AMOVA), mismatch distributions and F-statistics. The geographical distances between the localities were calculated with Geographic Distance Matrix Generator_v.1.2.3 (Ersts 2020), and Mantel tests for associations between the genetic and geographic distances, with 9,999 permutations, were run with NTSYSpc program (Rohlf 1998).
RESULTS
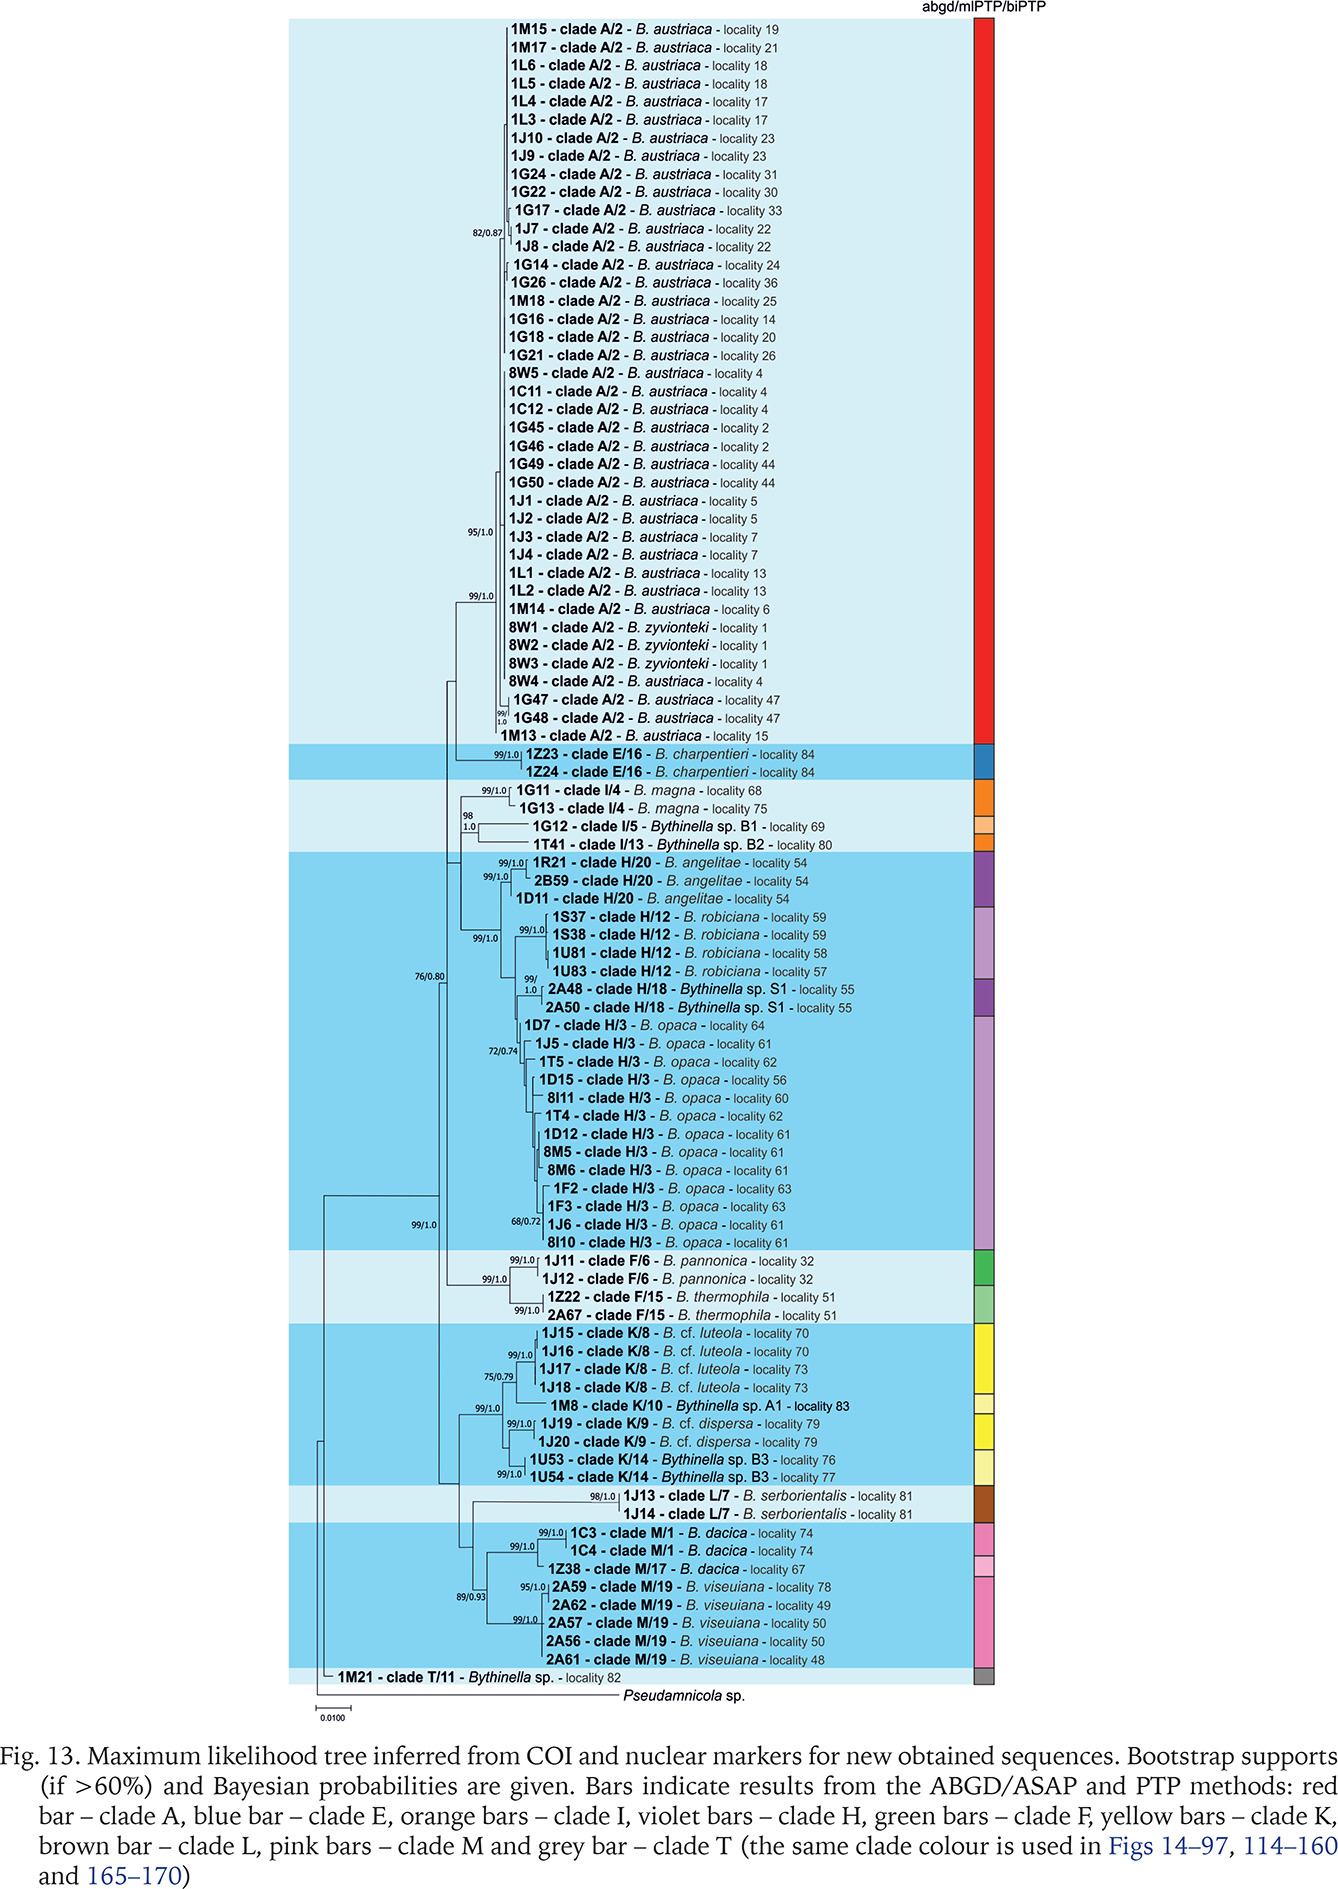
The tests by Xia et al. (2003) revealed no saturation for coding COI and H3. In all analyses, the topologies of the resulting phylograms were identical in both the maximum likelihood (ML) and Bayesian inference (BI). For COI 151 new sequences were obtained (GenBank accession numbers PV069821–PV069972) (Supplementary Fig. B.1). With the sequences from GenBank 1,437 sequences, 458 bp long, were analysed. There were 206 polymorphic sites and 360 haplotypes. Haplotype diversity (Hd) equalled 0.993±0.0004. The species delimitation analyses distinguished 86 mOTUs (molecular Operational Taxonomic Units), grouped in 19 clades. In 92 freshly collected specimens also five nuclear fragments were sequenced: GenBank accession numbers for 18S PV074076–PV074167 (Supplementary Fig. B.2); for 28S PV074168–PV074259 (Supplementary Fig. B.3); for H3 PV072433–PV072524 (Supplementary Fig. B.4); for ITS-1 PV070478–PV070569 (Supplementary Fig. B.5); for ITS-2 PV070570–PV070661 (Supplementary Fig. B.6). The phylogenetic inference on the six concatenated sequences (including mitochondrial and nuclear markers) resulted in nine clades (Fig. 13), identical with the nine of 19 COI clades: A, E, I, H, F, K, L, M and T.
Fig. 13
Maximum likelihood tree inferred from COI and nuclear markers for new obtained sequences. Bootstrap supports (if >60%) and Bayesian probabilities are given. Bars indicate results from the ABGD/ASAP and PTP methods: red bar – clade A, blue bar – clade E, orange bars – clade I, violet bars – clade H, green bars – clade F, yellow bars – clade K, brown bar – clade L, pink bars – clade M and grey bar – clade T (the same clade colour is used in Figs 14–97, 114–160 and 165–170)
MORPHOLOGICAL AND ANATOMICAL DIVERSITY
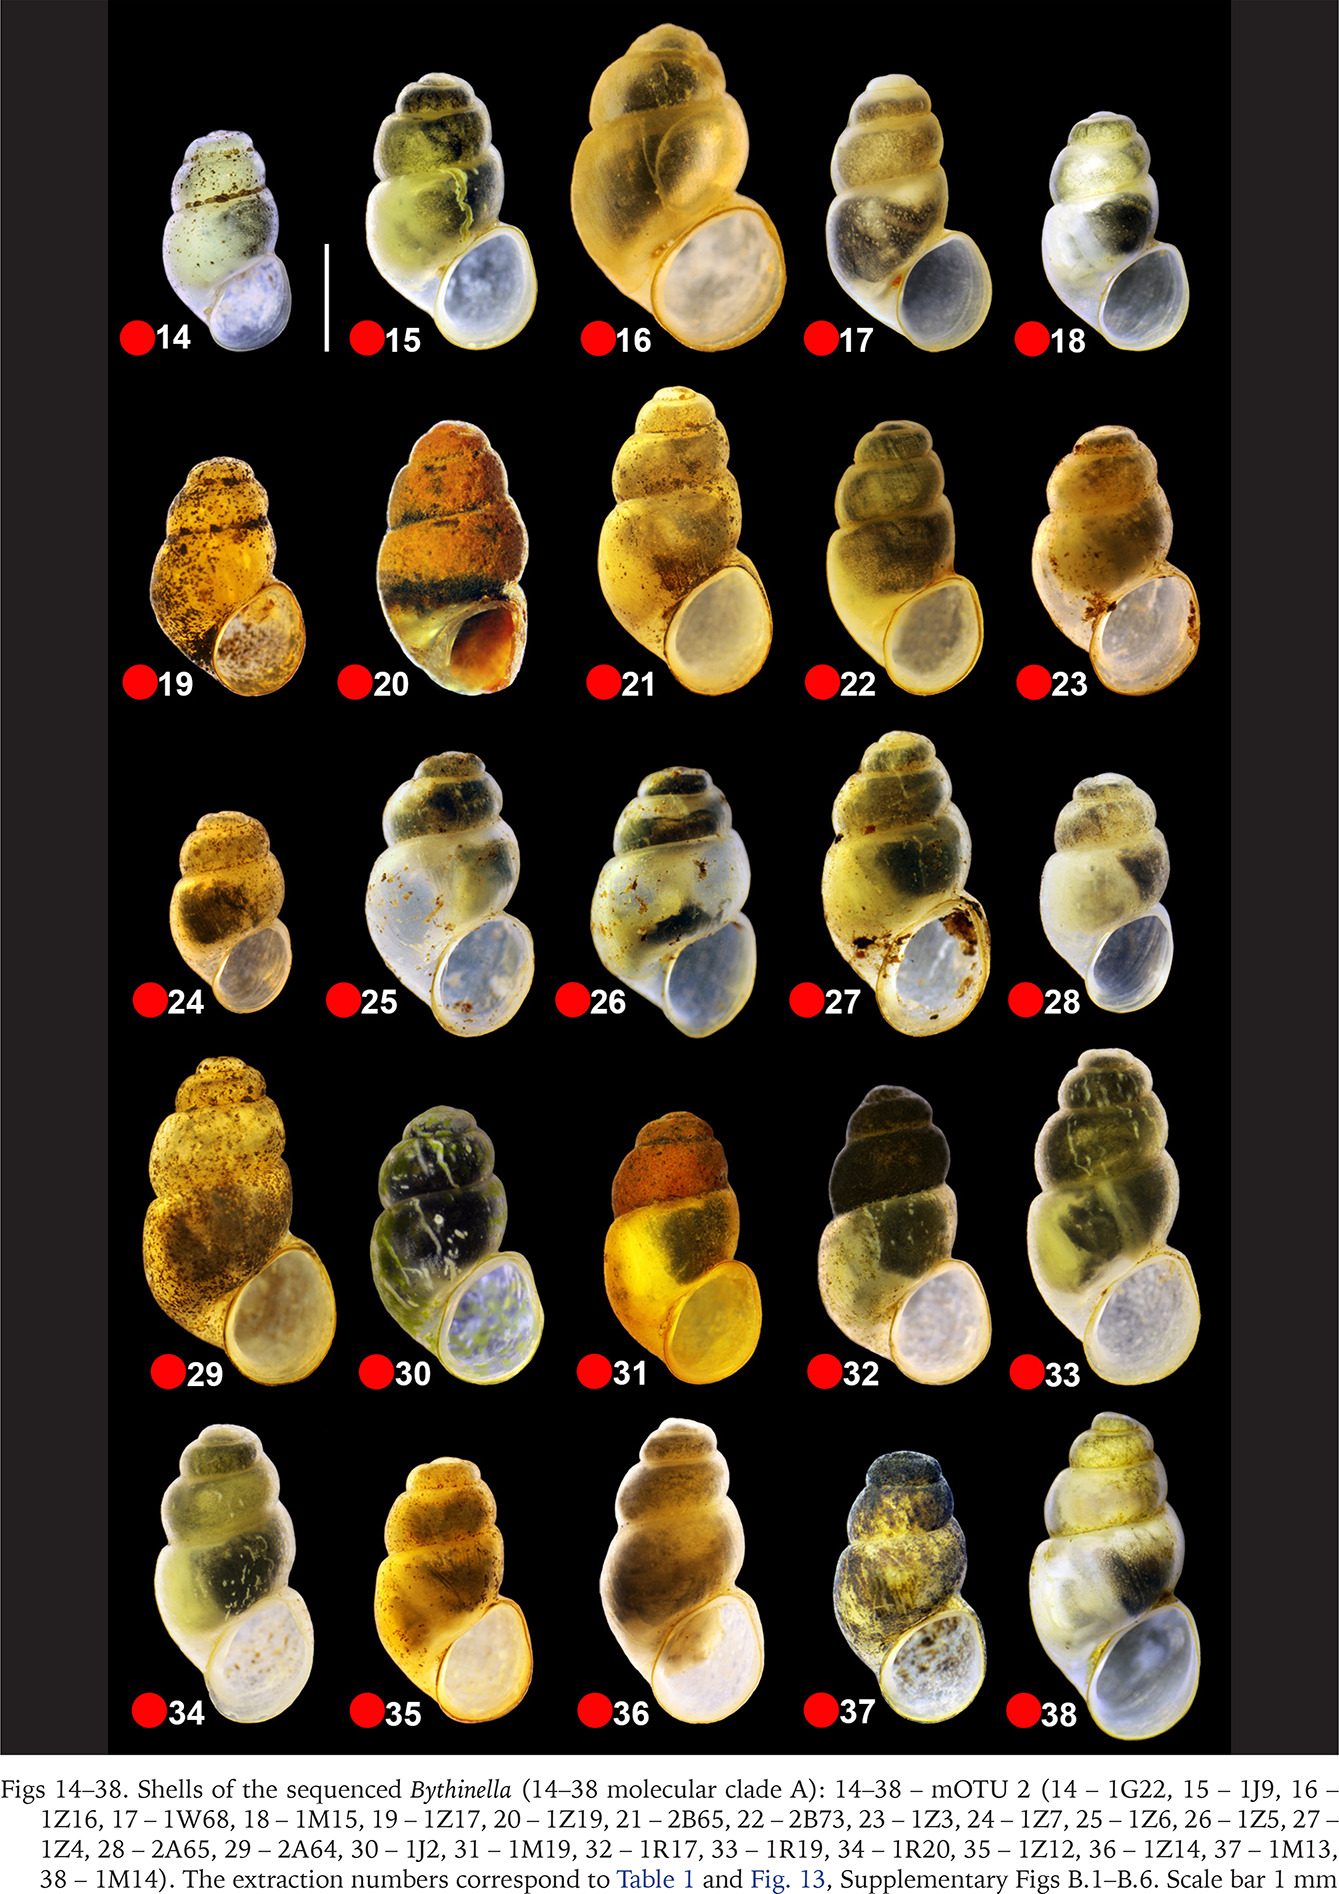
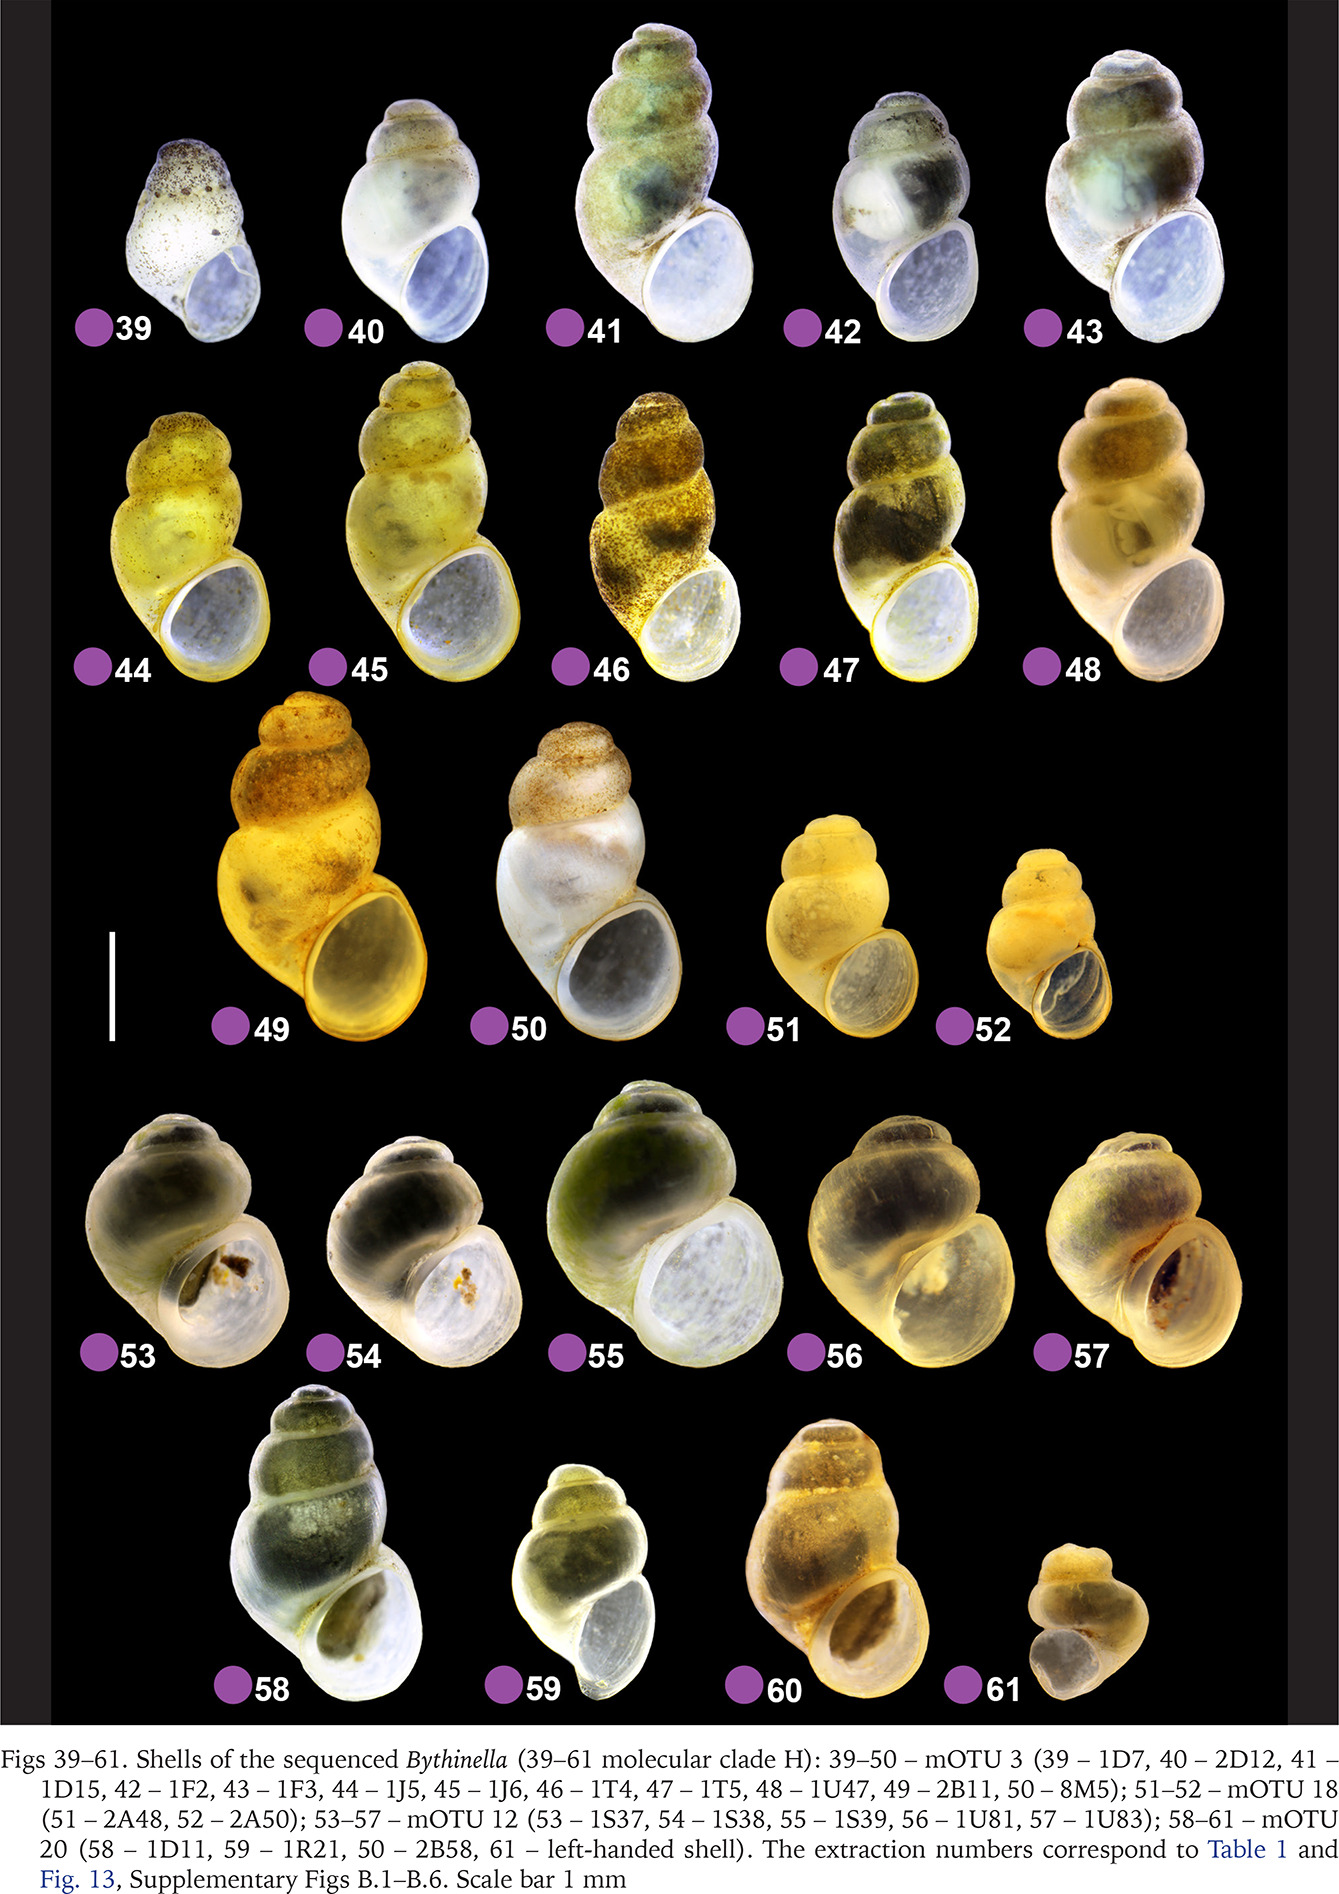
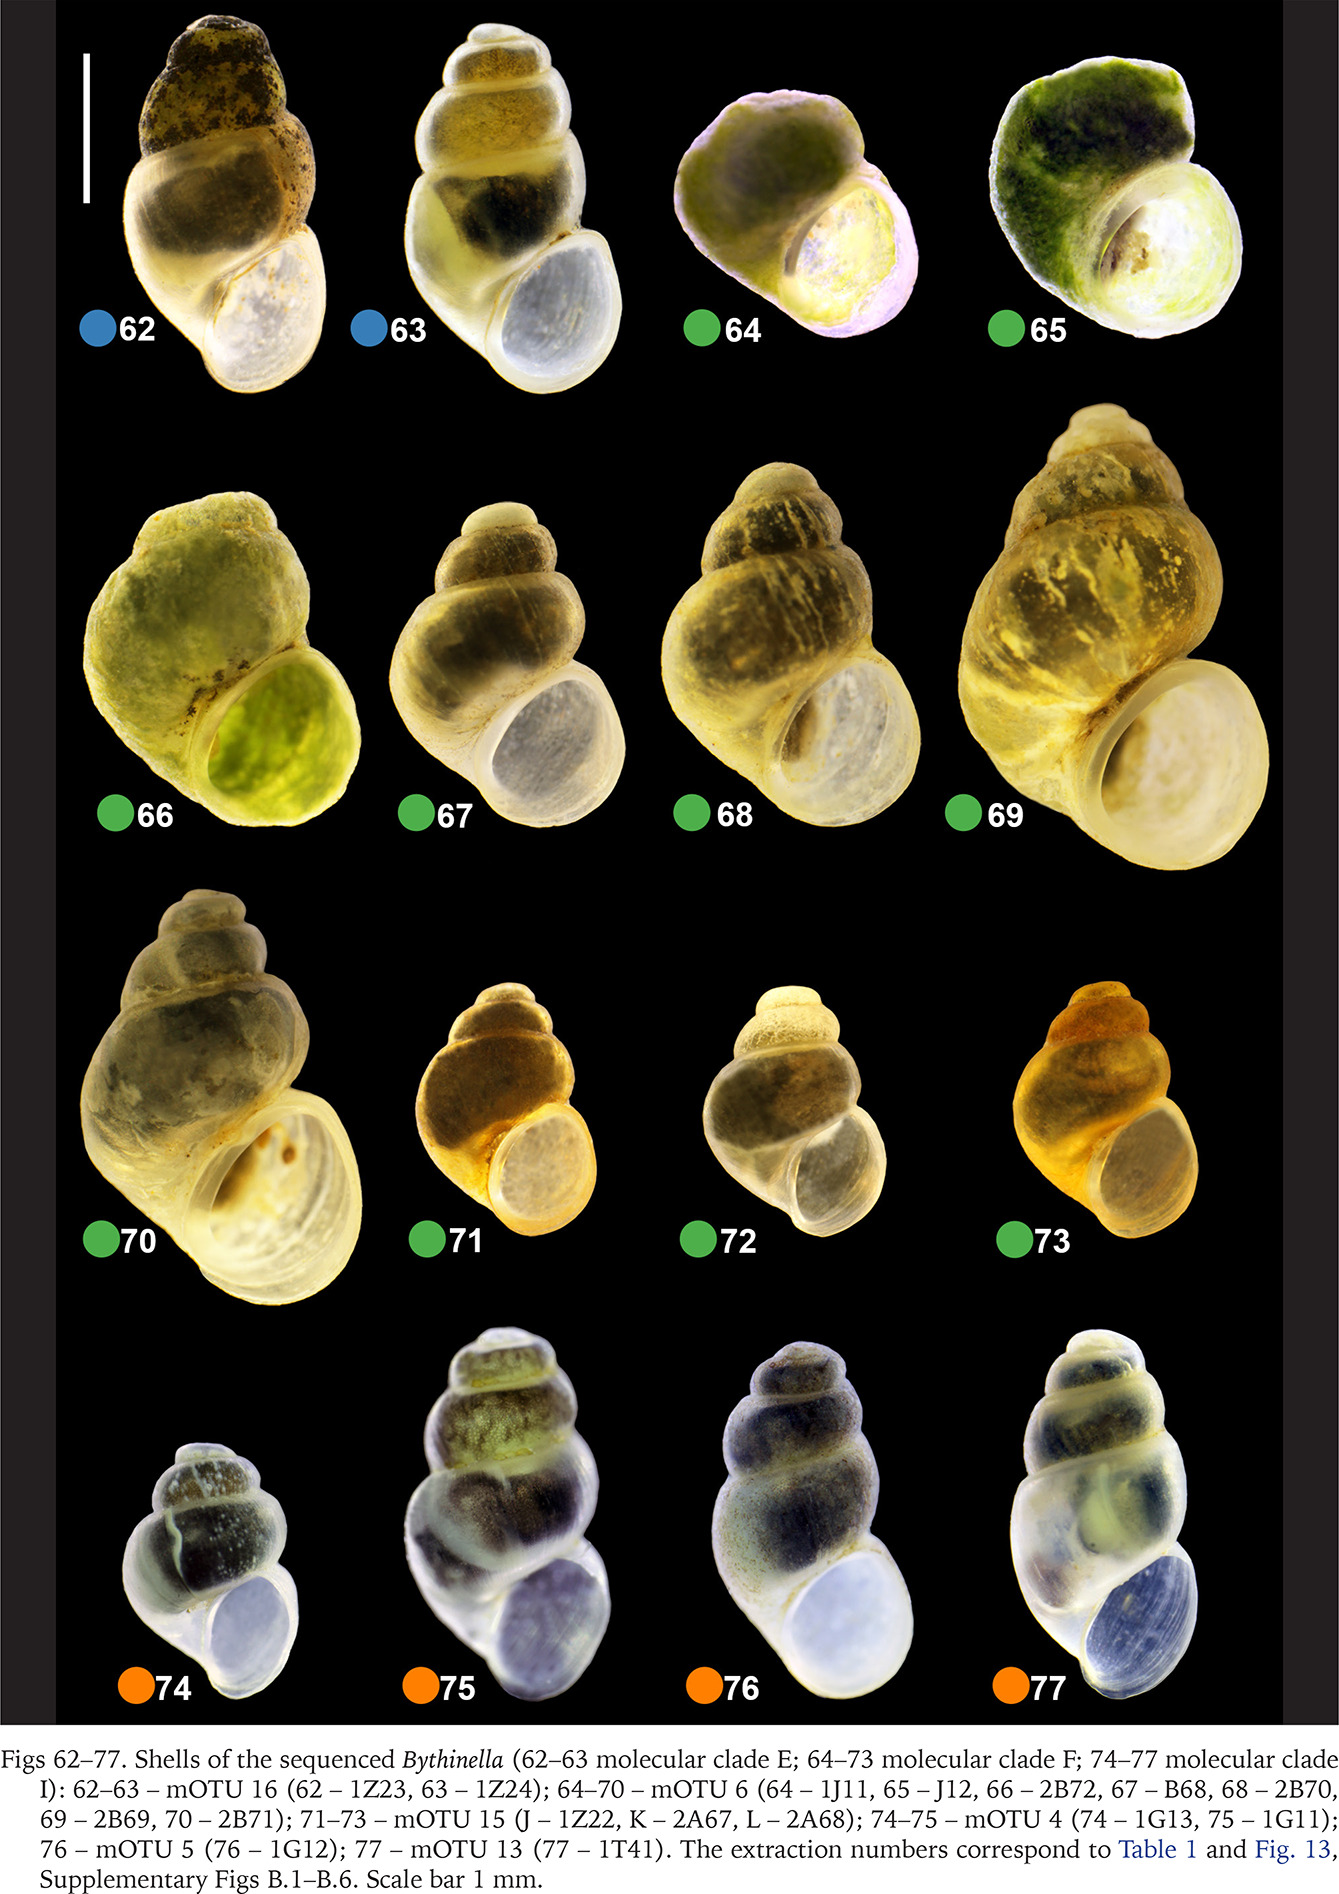
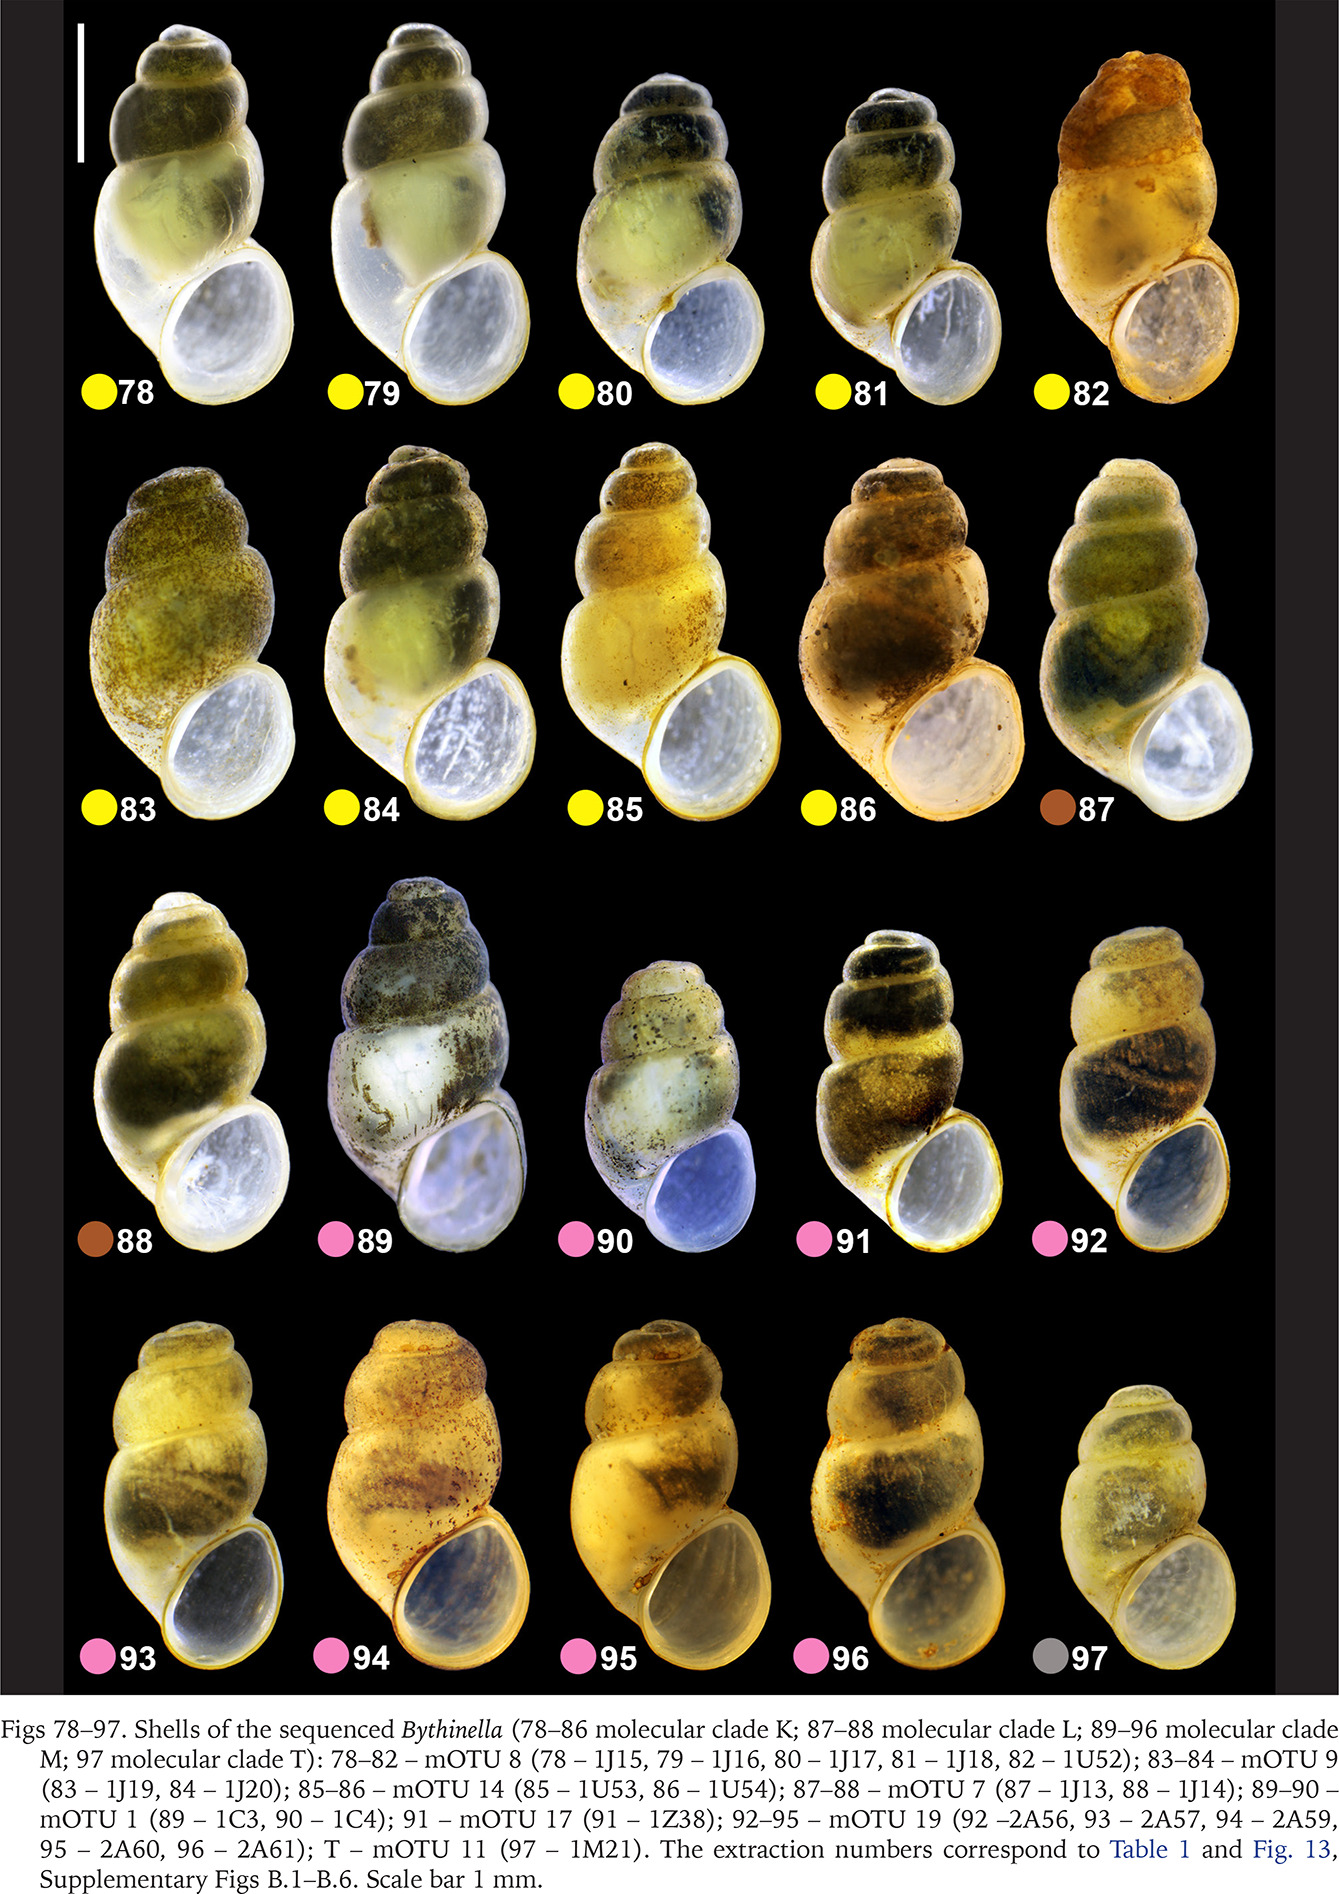
The highest number of studied populations – 47 – represented clade A. The shells of the snails representing this clade are barrel-shaped (Figs 14–38, red dots) and much less variable than the ones representing clade H, harbouring 13 newly studied populations (Figs 39–61, violet dots). In clade H there were some specimens with a low spire, not recorded in clade A. In clade H there was also found a dwarf and sinistral specimen of B. opaca (Prevorčnik & Falniowski 2018) (Fig. 61). The shells of the representatives of clade F (Figs 64–73, green dots) are the most characteristic, conic, and often with the cut spire (Figs 64–66) untypically for Bythinella. The latter resulted in misclassification of B. pannonica to the genus Sadleriana Clessin, 1890 for more than century. These shells are often bigger than the ones typical of Bythinella. The shells representing clades E (Figs 62–63, blue dots) and I (Figs 74–77, orange dots), were few in number, and like the representatives of clade L (Figs 87–88, brown dots), did not differ from the ones found in clade A. Wider variability was found within clade K (Figs 78–86, yellow dots) and M (Figs 89–96, pink dots). Clade T was represented by single specimen, whose shell was small (Fig. 97, grey dot).
Figs 14–38
Shells of the sequenced Bythinella (14–38 molecular clade A): 14–38 – mOTU 2 (14 – 1G22, 15 – 1J9, 16 – 1Z16, 17 – 1W68, 18 – 1M15, 19 – 1Z17, 20 – 1Z19, 21 – 2B65, 22 – 2B73, 23 – 1Z3, 24 – 1Z7, 25 – 1Z6, 26 – 1Z5, 27 – 1Z4, 28 – 2A65, 29 – 2A64, 30 – 1J2, 31 – 1M19, 32 – 1R17, 33 – 1R19, 34 – 1R20, 35 – 1Z12, 36 – 1Z14, 37 – 1M13, 38 – 1M14). The extraction numbers correspond to Table 1 and Fig. 13, Supplementary Figs B.1–B.6. Scale bar 1 mm
Figs 39–61
Shells of the sequenced Bythinella (39–61 molecular clade H): 39–50 – mOTU 3 (39 – 1D7, 40 – 2D12, 41 – 1D15, 42 – 1F2, 43 – 1F3, 44 – 1J5, 45 – 1J6, 46 – 1T4, 47 – 1T5, 48 – 1U47, 49 – 2B11, 50 – 8M5); 51–52 – mOTU 18 (51 – 2A48, 52 – 2A50); 53–57 – mOTU 12 (53 – 1S37, 54 – 1S38, 55 – 1S39, 56 – 1U81, 57 – 1U83); 58–61 – mOTU 20 (58 – 1D11, 59 – 1R21, 50 – 2B58, 61 – left-handed shell). The extraction numbers correspond to Table 1 and Fig. 13, Supplementary Figs B.1–B.6. Scale bar 1 mm
Figs 62–77
Shells of the sequenced Bythinella (62–63 molecular clade E; 64–73 molecular clade F; 74–77 molecular clade I): 62–63 – mOTU 16 (62 – 1Z23, 63 – 1Z24); 64–70 – mOTU 6 (64 – 1J11, 65 – J12, 66 – 2B72, 67 – B68, 68 – 2B70, 69 – 2B69, 70 – 2B71); 71–73 – mOTU 15 (J – 1Z22, K – 2A67, L – 2A68); 74–75 – mOTU 4 (74 – 1G13, 75 – 1G11); 76 – mOTU 5 (76 – 1G12); 77 – mOTU 13 (77 – 1T41). The extraction numbers correspond to Table 1 and Fig. 13, Supplementary Figs B.1–B.6. Scale bar 1 mm.
Figs 78–97
Shells of the sequenced Bythinella (78–86 molecular clade K; 87–88 molecular clade L; 89–96 molecular clade M; 97 molecular clade T): 78–82 – mOTU 8 (78 – 1J15, 79 – 1J16, 80 – 1J17, 81 – 1J18, 82 – 1U52); 83–84 – mOTU 9 (83 – 1J19, 84 – 1J20); 85–86 – mOTU 14 (85 – 1U53, 86 – 1U54); 87–88 – mOTU 7 (87 – 1J13, 88 – 1J14); 89–90 – mOTU 1 (89 – 1C3, 90 – 1C4); 91 – mOTU 17 (91 – 1Z38); 92–95 – mOTU 19 (92 –2A56, 93 – 2A57, 94 – 2A59, 95 – 2A60, 96 – 2A61); T – mOTU 11 (97 – 1M21). The extraction numbers correspond to Table 1 and Fig. 13, Supplementary Figs B.1–B.6. Scale bar 1 mm.
The PCA (Fig. 98) on the seven variables (Fig. 12, Table 2) confirmed broad overlapping of the variability ranges for the molecularly distinguished clades. PC1 explained 46% of the observed variation, is usually interpreted as the size component. This may be simply a consequence of allometric growth as the main source of the variation, thus neither PC1 is free of the shape variation nor the other PCs free of size variation, but in general one can assume that PC1 describes mostly the size differences, as well as sex dimorphism and polymorphism. 46% is low enough to suggest high input of the shape component in the analysed differentiation. Size was most variable in clade F, nearly twice wider along PC1 than the other clades. The relatively big ellipsoide of clade I reflects a small number of sample specimen. Clade E, with few shells, was enclosed by the smallest ellipsoid, but that of the more numerous representatives of clade M was only slightly larger; shells in this clade varied little in size and shape (Fig. 98).
Fig. 98
Principal component analysis (PCA) on the shell of Bythinella for different clades. Shell measurements: a – shell height; b – body whorl breadth; c – aperture height; d – spire height; e – aperture breadth; α – apex angle measured between the lines tangential to the spire; β – angle between the body whorl suture and the line perpendicular to the columella (see Fig. 12)
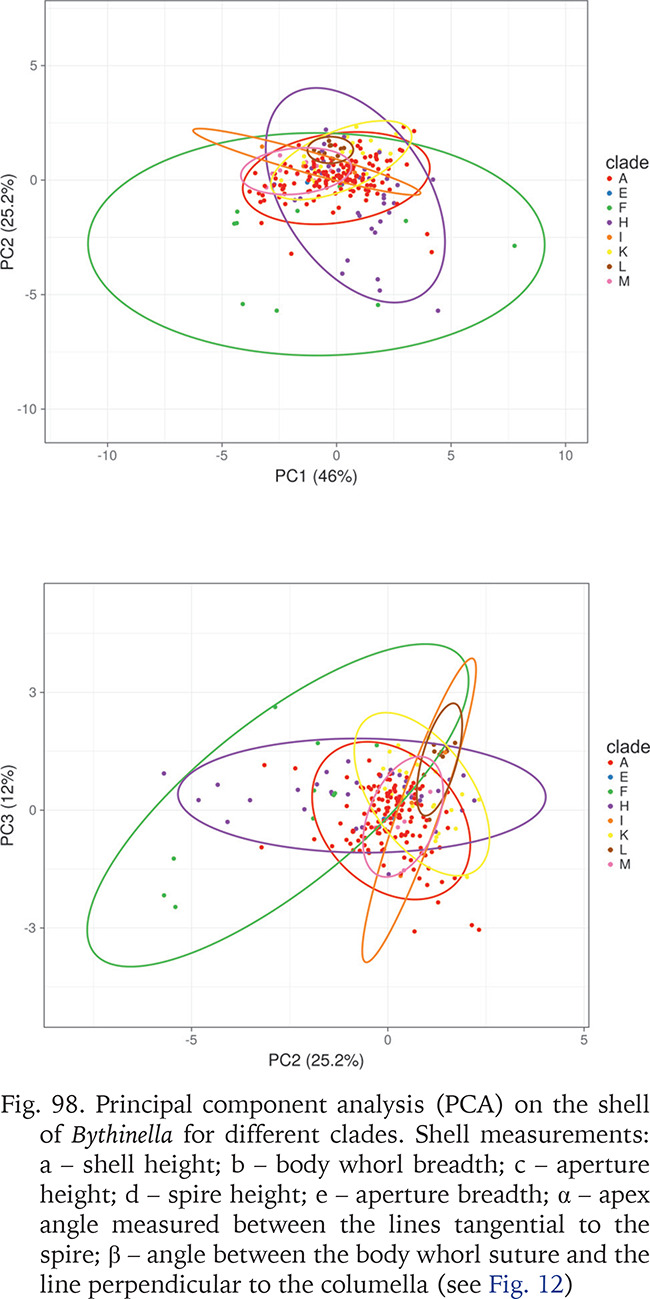
PC2 explained 25% and PC3 12% of the total variability; the PC3 explained more variability than expected due to chance alone (broken-stick and accumulation zone models). The Hungarian clade F is most variable along both PC1 and PC2. Clade A is represented by the highest number of specimens and fills only a small part of the hyperspace, PC2 and PC3 reflect very restricted shape variability in this clade, far less wide (especially along PC2) than in clade H represented by fewer specimens.
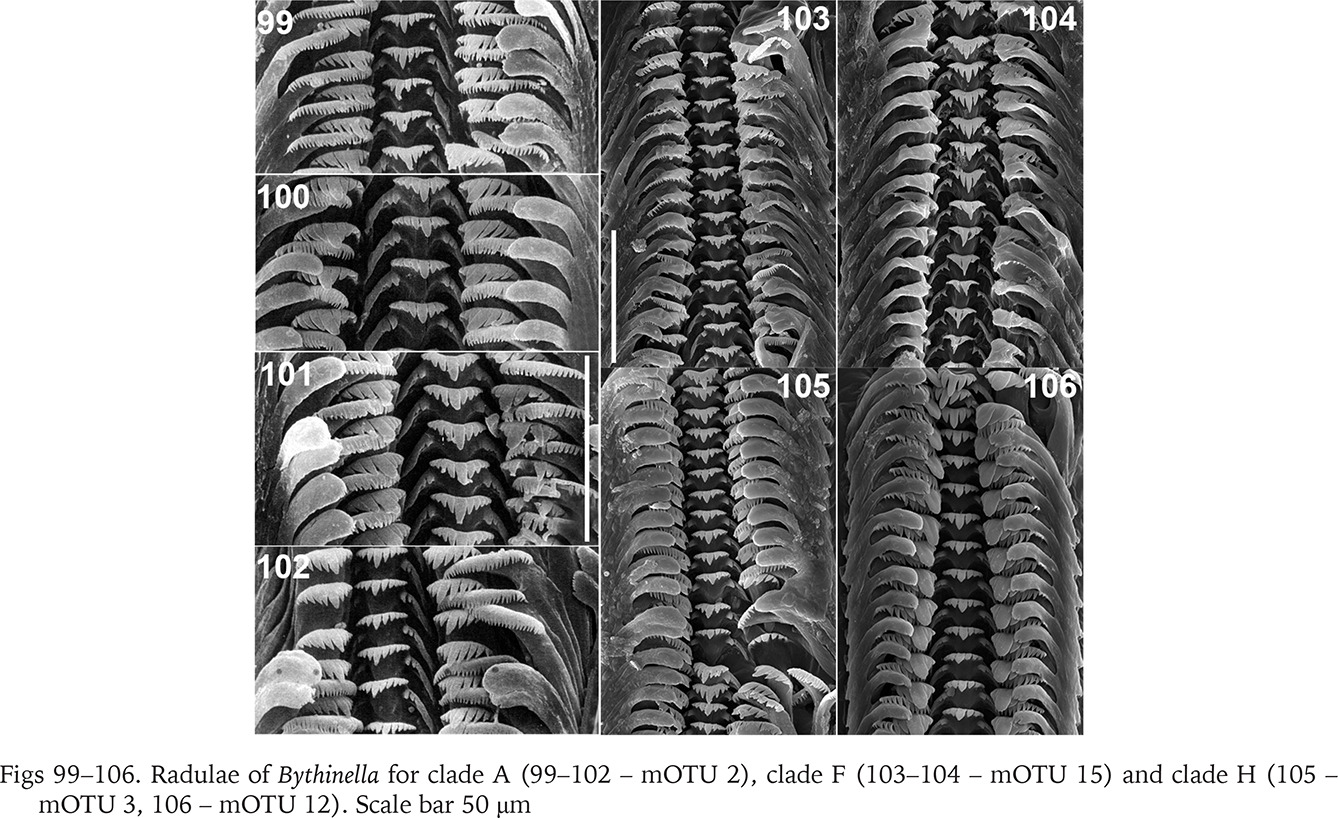
The radulae of Bythinella austriaca – clade A (Figs 99–102) have central teeth with five smaller cusps on both sides of the central one, and two or three basal cusps. The lateral teeth follow the formula 4-1-4, inner and outer marginal teeth bear 22–25 cusps. In clade F (B. thermophila) the radulae (Figs 103–104) have the central tooth with four sharp cusps on both sides of the approximately twice longer central one. The lateral with 3-1-4 cusps, the biggest one moderately broad, inner marginal tooth with about 22 moderately big cusps, outer marginal tooth with 30 very fine ones. The radulae of the snails from clade H (mOTU 3 – B. opaca, Fig. 105) have the central tooth with three (sometimes rudimentary fourth) cusps on both sides of rather broad central one, and one pair of basal cusps (or with rudimentary second pair), lateral tooth with 2-1-3 relatively massive cusps, inner marginal tooth with about 20 sharp cusps, on the outer marginal cusps vestigial. In clade H (mOTU 12 – B. robiciana) in the radula (Fig. 106) the cusps on the cutting edge of the central tooth are broad, three at both sides of the central one, and two pairs of the basal cusps. The lateral tooth with a characteristic, unusually broad and massive biggest cusp, the formula 2-1-2, inner marginal tooth with 12–14 long and narrow cusps, outer with about 20 extremely fine, vestigial cusps.
Figs 99–106
Radulae of Bythinella for clade A (99–102 – mOTU 2), clade F (103–104 – mOTU 15) and clade H (105 – mOTU 3, 106 – mOTU 12). Scale bar 50 μm
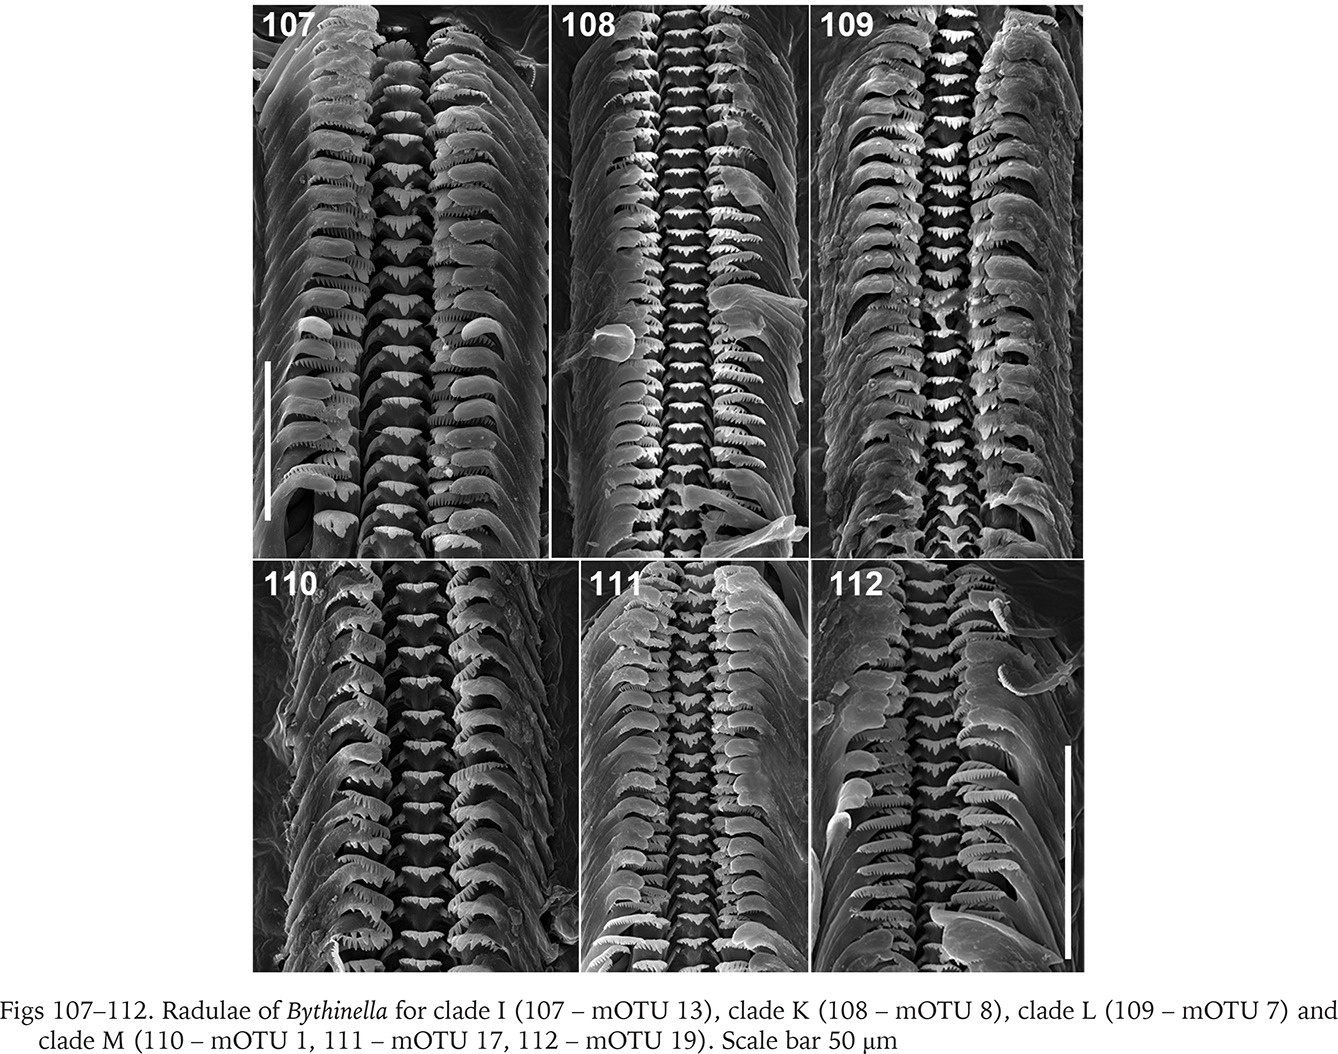
In clade I (Bythinella sp. B2, mOTU 13) the radula (Fig. 107) bears relatively broad cusps on the central and lateral tooth. The central tooth has four cusps on both sides of the cutting edge and two pairs of basal cusps. The lateral has 2-1-3 cusps, the biggest cusp proportionally broader than in the majority of Bythinella, although not as wide as in B. robiciana. The inner marginal tooth has about 22 cusps, the outer has about 15 fine ones. In clade K (B. cf. luteola) the radula (Fig. 108) bears short and squat cusps on the central and lateral teeth. The central one has four – five cusps on both sides of the central cusp, and one pair of the basal cusps. The lateral has 2-1-4, the inner marginal about 22, the outer marginal about 12 rather big cusps. The central tooth of the radula (Fig. 109) of the snails from clade L (B. serborientalis) is characteristic: the cusps are broad, the central one slightly longer than the adjacent four ones, and three pairs of the basal cusps, which is not typical of Bythinella. The lateral tooth has 2-1-5 narrow cusps, the inner marginal has about 24, on the outer the cusps rudimentary. The central cusp on the central tooth (Figs 110–111) of the snails from clade M, mOTUs 1 and 17 (B. dacica) is slightly bigger than the adjacent ones, four on both sides, and one pair of the basal cusps. The lateral tooth has sharp and narrow 3-1-5 cusps, about 24 cusps on the inner marginal and fine cusps on the outer marginal tooth. The radula of the representatives from clade M, mOTU 19 (B. viseuiana) has a central tooth (Fig. 112) with four blunt cusps on both sides of the cutting edge, two pairs of the basal cusps, 2-1-4 cusps on the lateral, about 20 on the inner marginal and vestigial cusps on the outer marginal tooth.
Figs 107–112
Radulae of Bythinella for clade I (107 – mOTU 13), clade K (108 – mOTU 8), clade L (109 – mOTU 7) and clade M (110 – mOTU 1, 111 – mOTU 17, 112 – mOTU 19). Scale bar 50 μm
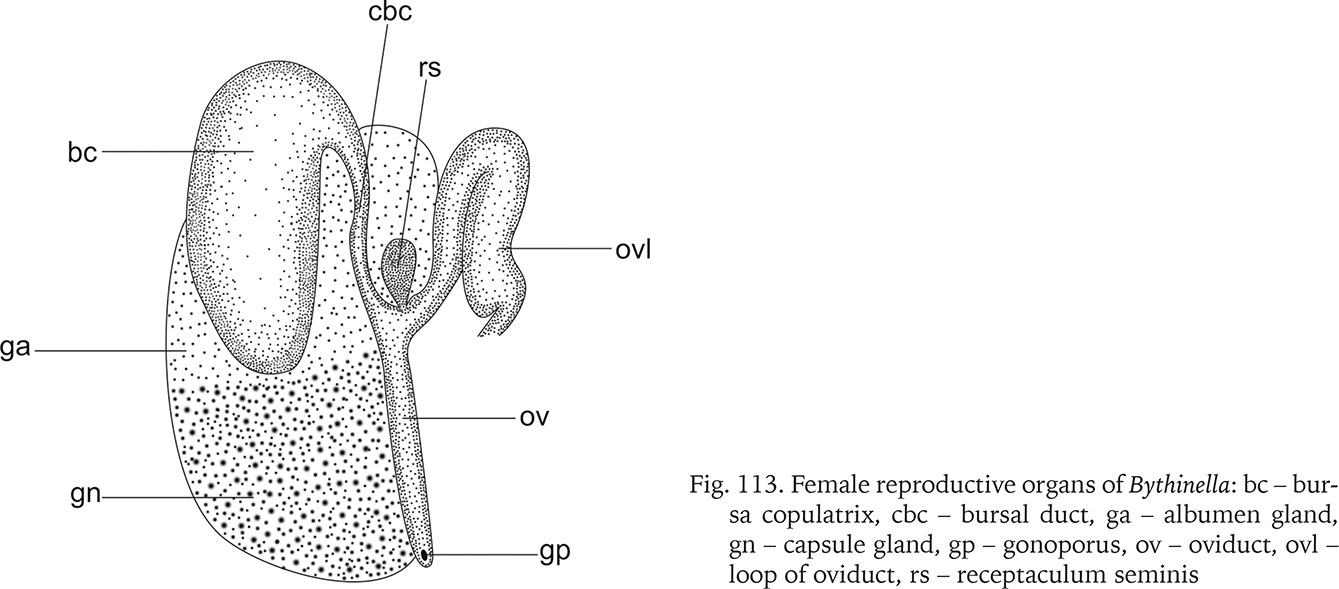
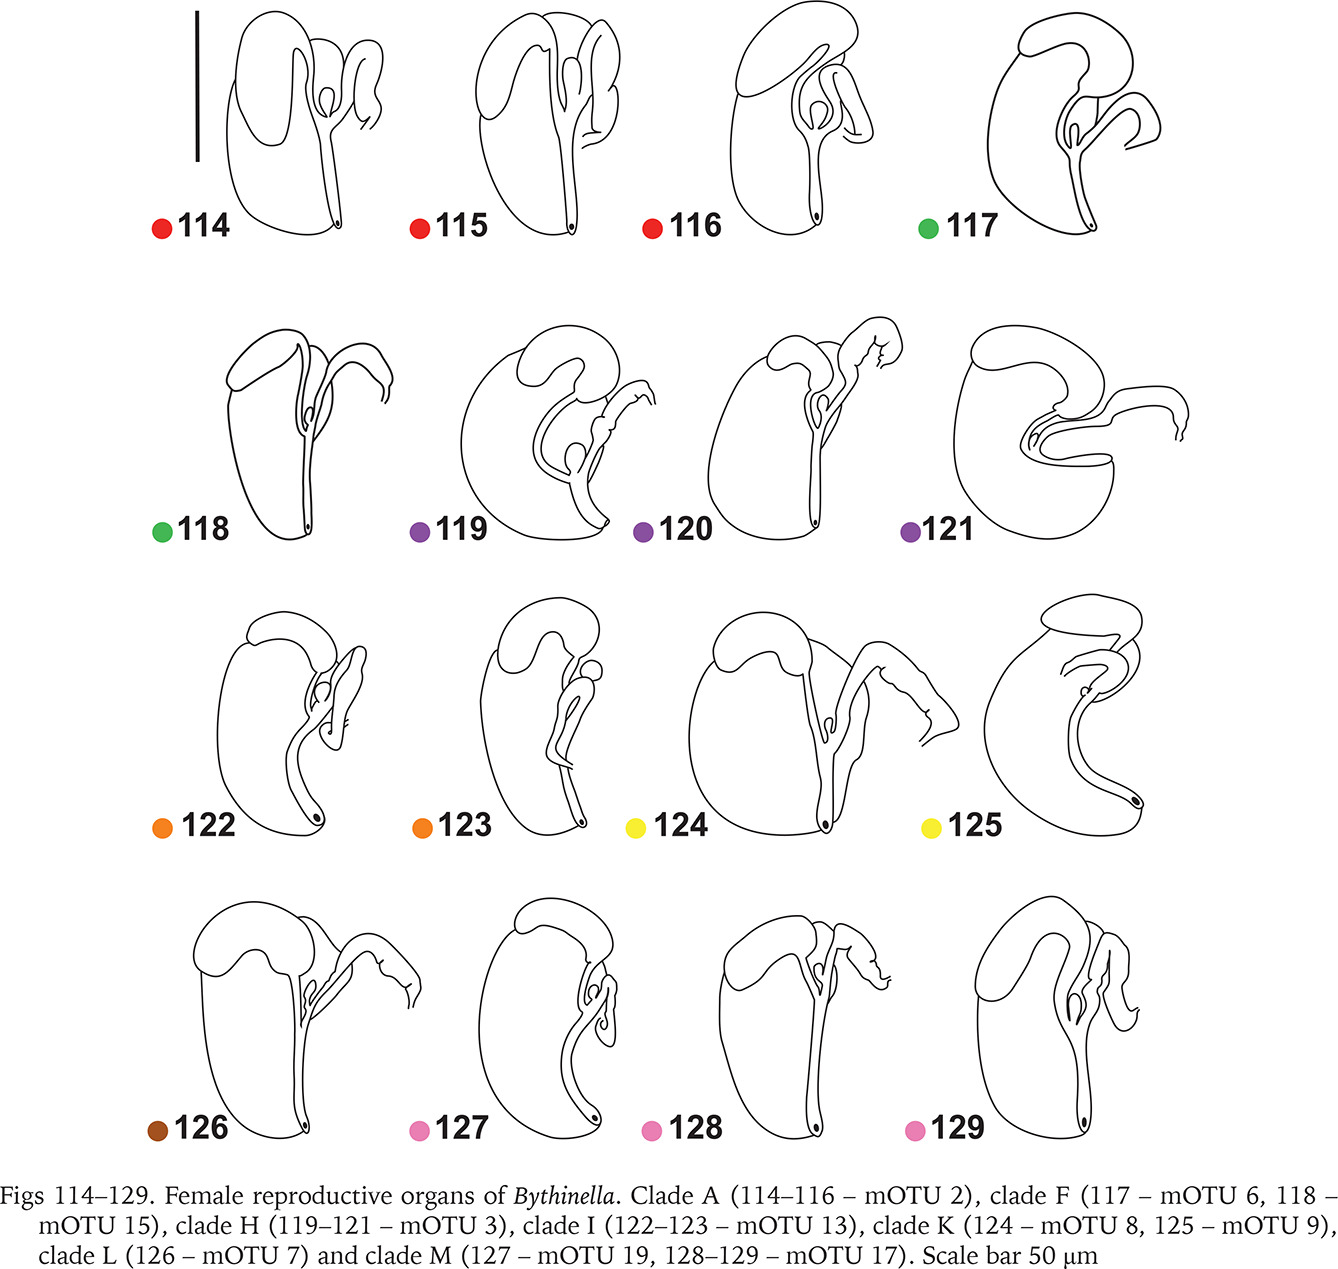
The renal and pallial section of the female reproductive organs (Figs 113–129) of the studied Bythinella consisted of a horseshoe or approximately straight, moderately thickened loop of the renal oviduct, the moderately big bursa copulatrix, and usually small receptaculum seminis (Figs 114–129). In clade A (Figs 114–116, red dots) there is an oval receptaculum of various size, and the bursa copulatrix is bulky or slim, J- or U-shaped. In clade F (Figs 117–118, green dots) the receptaculum was small, and the bursa from medium in size to big, U-shaped, or straight. In clade H (Figs 119–121, violet dots) the bursa was often exceptionally proportionally big to the accessory gland complex (albuminoid and nidamental gland), U-shaped, the receptaculum rather big. In clade I (Figs 122–123, orange dots) the loop of the oviduct was slightly thickened, the bursa small, J-shaped, or nearly straight and with a moderately big receptaculum. In clade K (Figs 124–125, yellow dots) the receptaculum was extremely small, U-shaped, or straight and with a rather small bursa and relatively massive loop of the oviduct. In clades L (Fig. 126, brown dot) and M (Figs 127–129, pink dots) the bursa was small, straight, or nearly straight, and had an extremely small receptaculum.
Fig. 113
Female reproductive organs of Bythinella: bc – bursa copulatrix, cbc – bursal duct, ga – albumen gland, gn – capsule gland, gp – gonoporus, ov – oviduct, ovl – loop of oviduct, rs – receptaculum seminis
Figs 114–129
Female reproductive organs of Bythinella. Clade A (114–116 – mOTU 2), clade F (117 – mOTU 6, 118 – mOTU 15), clade H (119–121 – mOTU 3), clade I (122–123 – mOTU 13), clade K (124 – mOTU 8, 125 – mOTU 9), clade L (126 – mOTU 7) and clade M (127 – mOTU 19, 128–129 – mOTU 17). Scale bar 50 μm
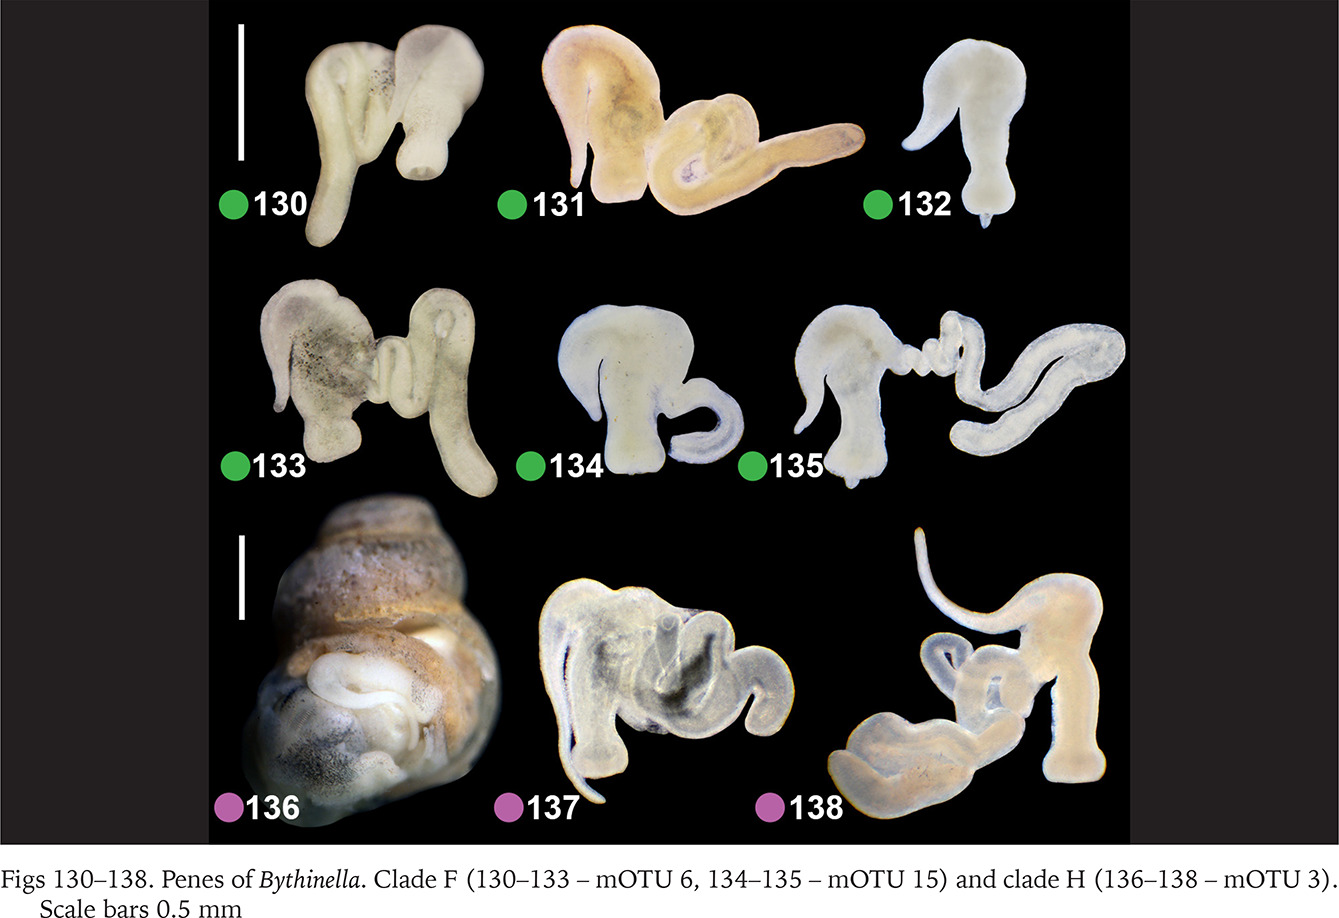
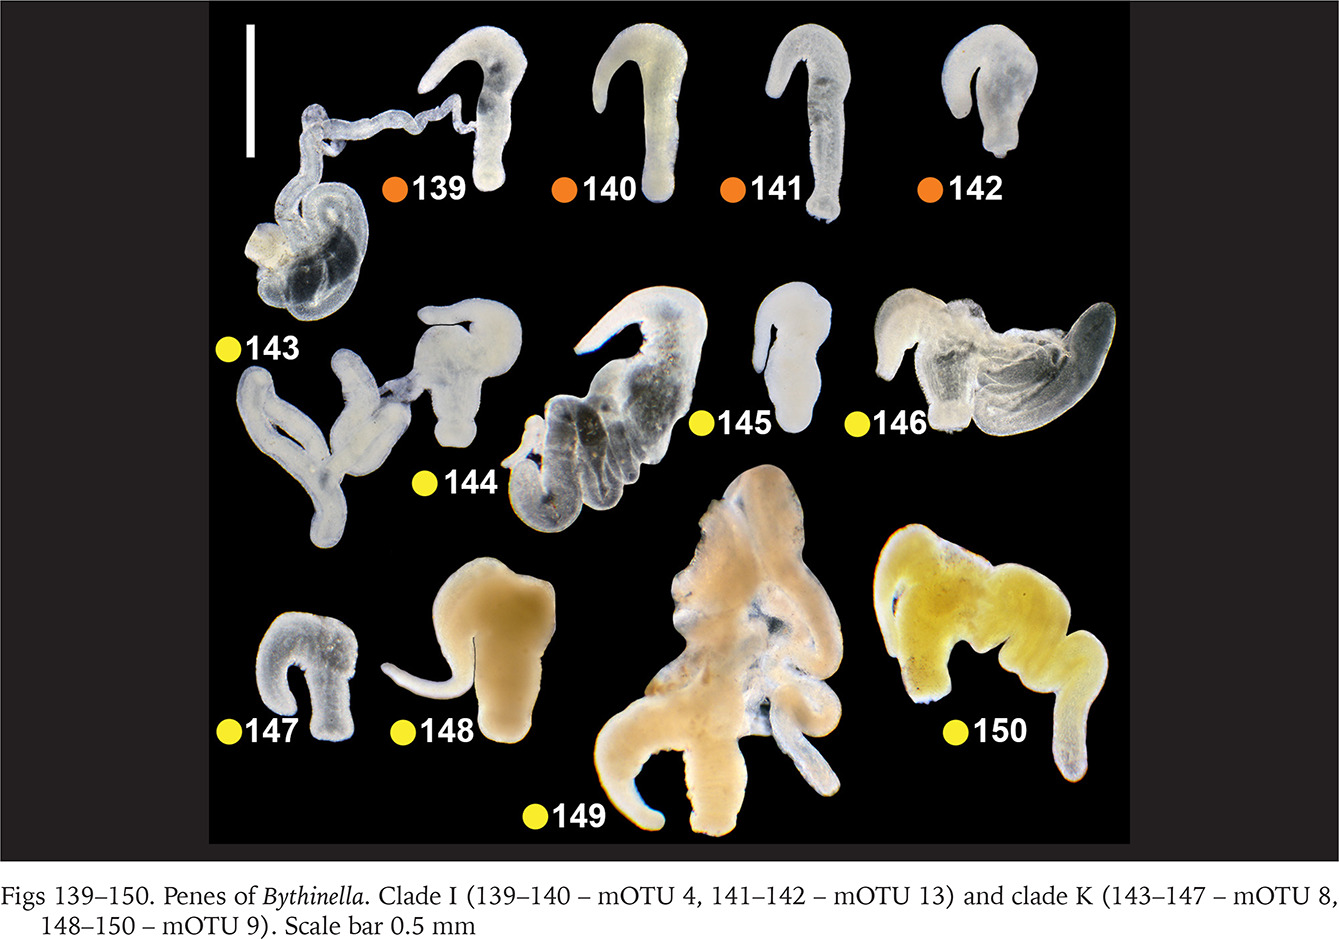
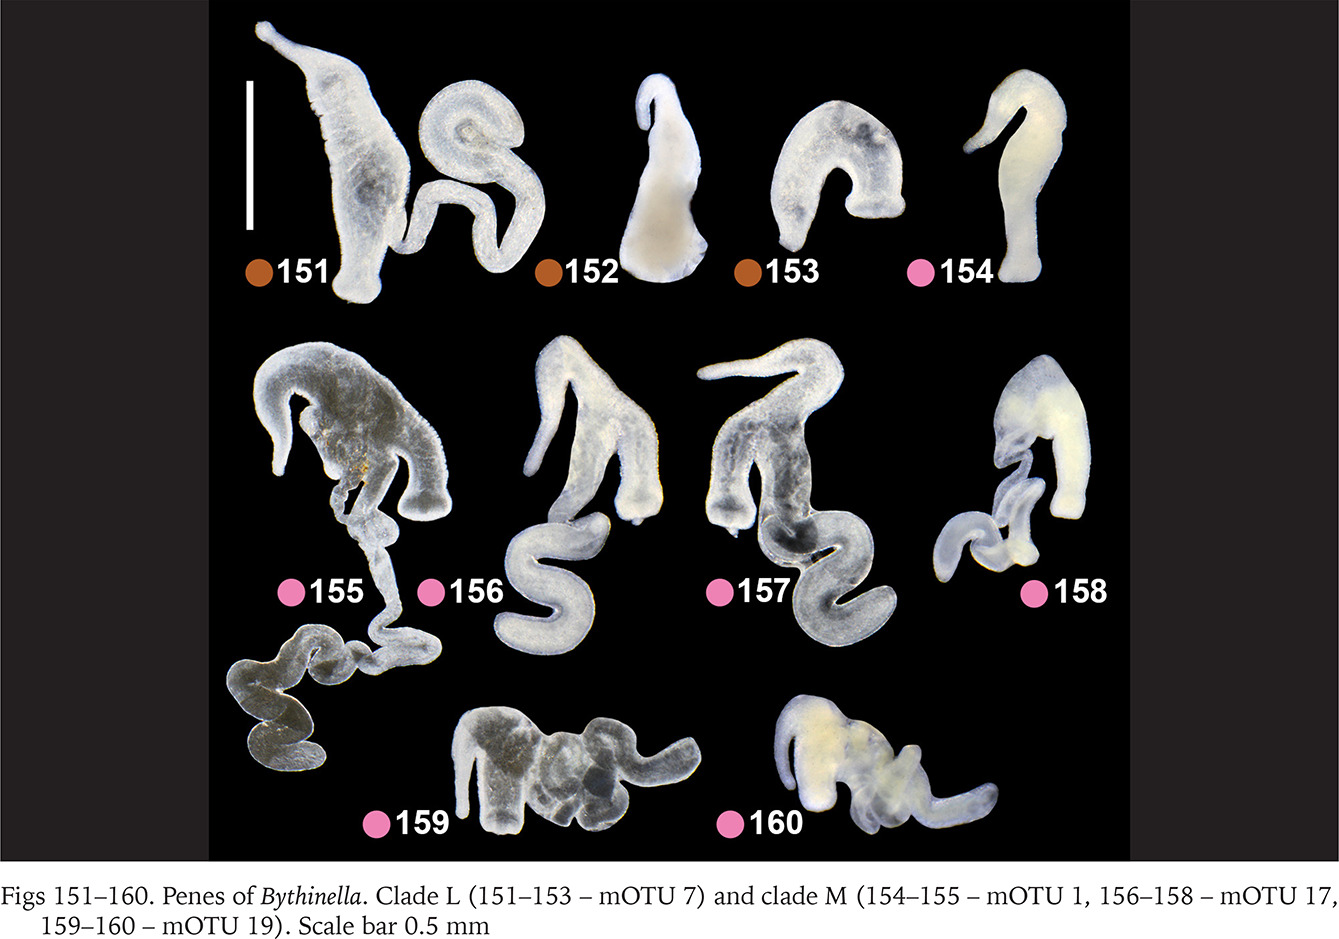
Within clade F there were no differences in the penis (Figs 130–135, green dots) between the two species belonging to this clade (Bythinella pannonica – mOTU 6 and B. thermophila – mOTU 15), the flagellum, harbouring the outlet of the tubular glans, was rather massive. The penis of B. opaca – mOTU 3, clade H, was characterised by strikingly slender in both arms, coupled with the strikingly thickened proximal part of the tubular gland (Figs 136–138, violet dots). In clade I (mOTU 4 – B. magna, mOTU 13 – Bythinella sp. B2) the penes were slender, with the short right arm harbouring the vas deferens (Figs 139–142, orange dots); it is noteworthy that the evidently contracted penis of B2 markedly differed from the other presented for this species, while the latter was identical as in B. magna. In clade K marked with yellow dots the penes of B. cf. luteola – mOTU 8 (Figs 143–147) do not differ from the ones of B. cf. dispersa – mOTU 9 (Figs 148–150), in both species the flagellum is rather massive, and the right arm more or less contracted. The penes of B. serborientalis – mOTU 7, clade L (Figs 151–153, brown dots) look strange, but this is evidently artefactual, caused by preservation. The flagellum is markedly thickened distally, the right arm slender, and two arms untypically arranged in one line. Within clade M, marked with pink dots, the flagellum was less massive in B. dacica (Figs 154–157) than in B. viseuiana (Figs 158–160).
Figs 130–138
Penes of Bythinella. Clade F (130–133 – mOTU 6, 134–135 – mOTU 15) and clade H (136–138 – mOTU 3). Scale bars 0.5 mm
MOLECULAR ANALYSES
Cytochrome c oxidase
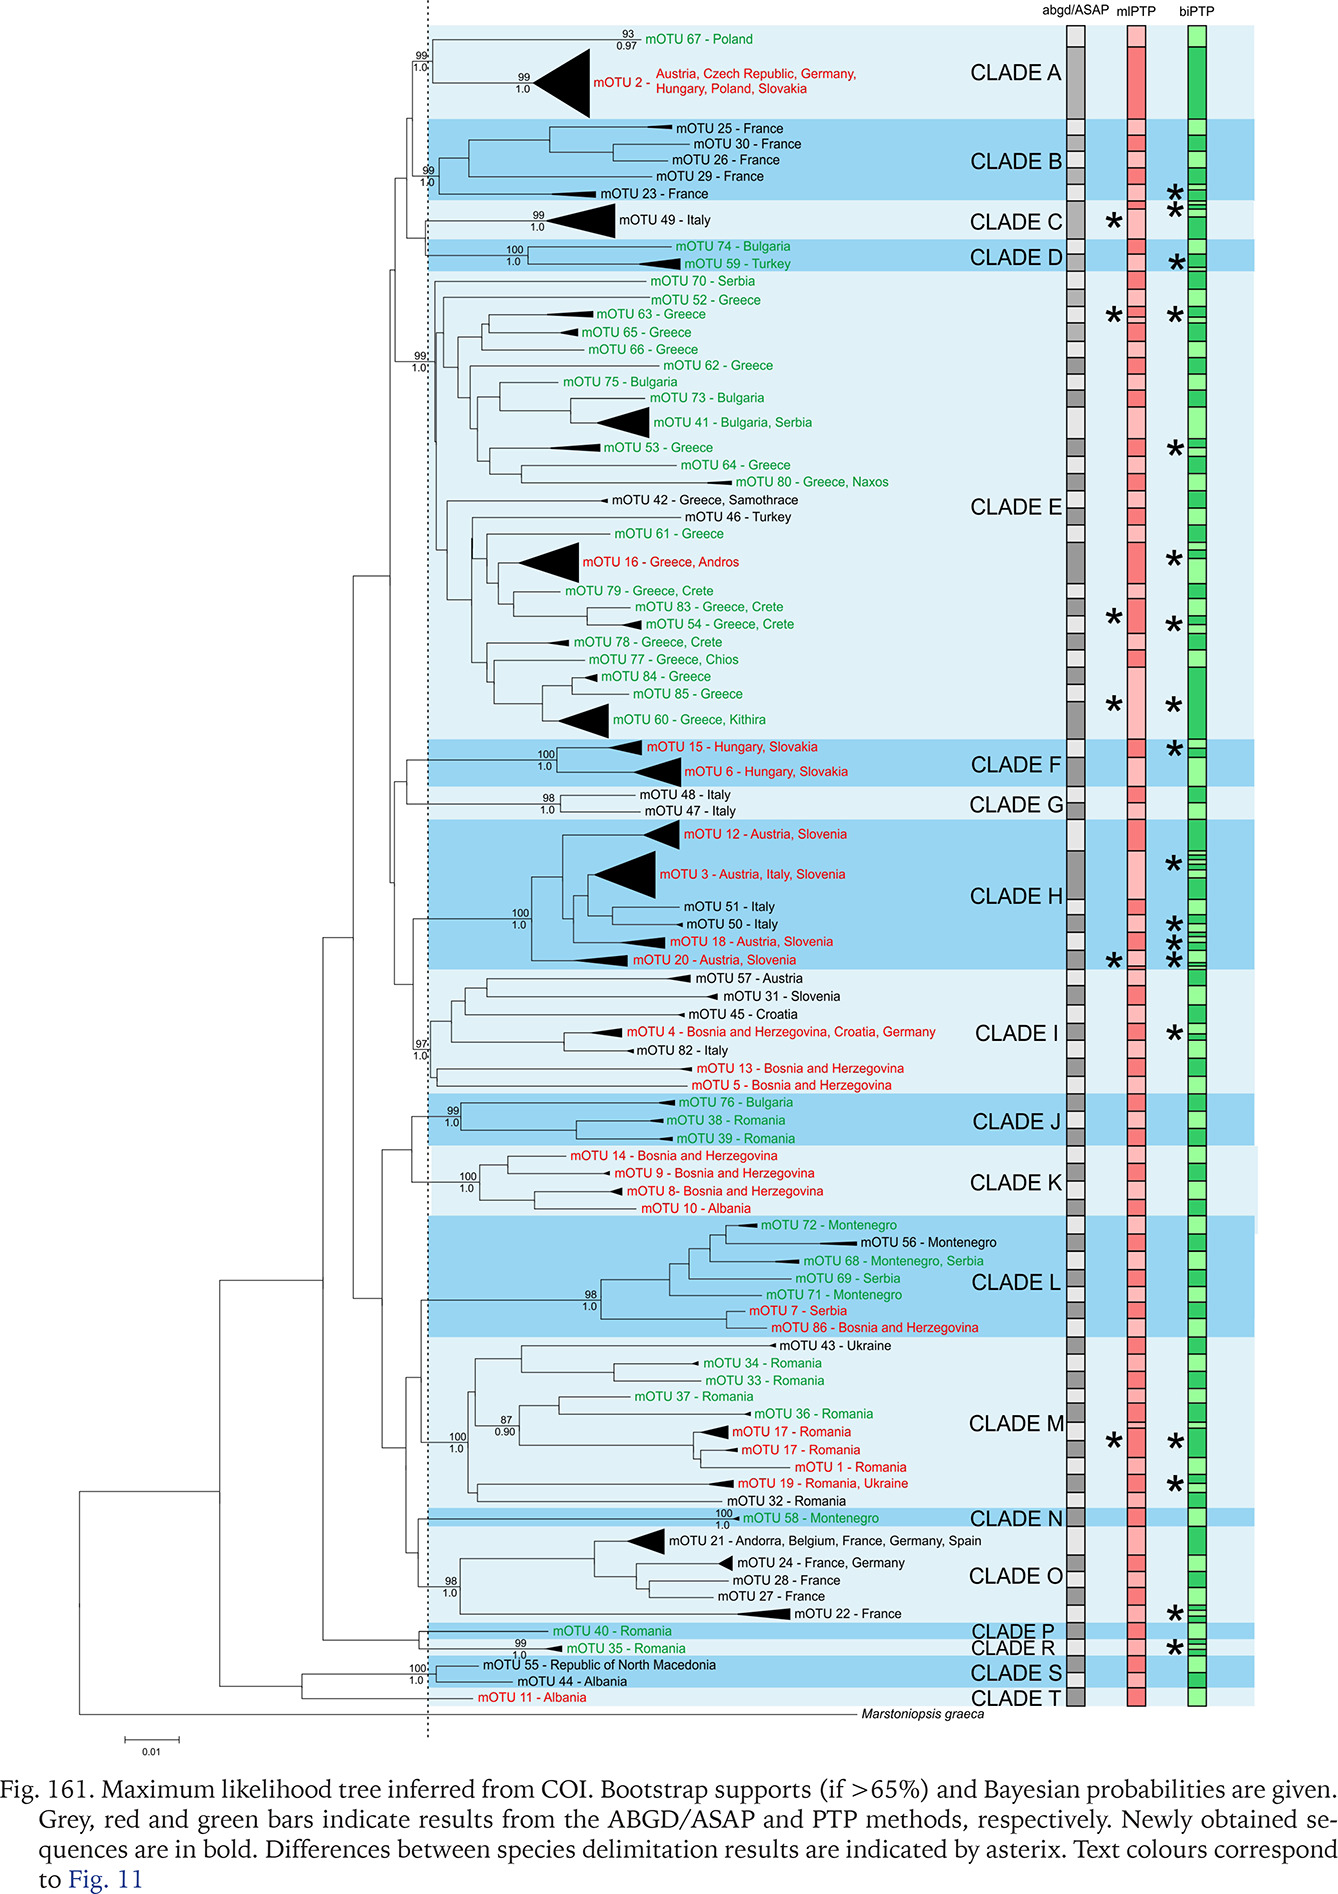
The new sequences, haplotypes, and localities are presented in Table 1. All the sequences and localities are presented in Supplementary Table A.1. As already mentioned, the species delimitation resulted in 86 mOTUs (presumably species), grouped in 19 clades (Fig. 161). The majority of clades are well supported, bootstrap values approaching 100%, but interclade relationships remain obscure, since the bootstrap values are low, thus it is nearly one big polytomy. The results of the three techniques of species delimitation used were somewhat different (Fig. 161). ABGD and ASAP distinguished the lowest number of mOTUs, thus, applying conservative rule and phylogenetic data, this value was accepted as the safest and used in the other analyses. In the case of PTP, there were 86 mOTUs for mlPTP, and 111 for bpPTP.
Fig. 161
Maximum likelihood tree inferred from COI. Bootstrap supports (if >65%) and Bayesian probabilities are given. Grey, red and green bars indicate results from the ABGD/ASAP and PTP methods, respectively. Newly obtained sequences are in bold. Differences between species delimitation results are indicated by asterix. Text colours correspond to Fig. 11
At most of the localities, including all the sampled by us, the representatives of only one clade and one mOTU was found. Out of the five reference localities in Romania there were three where representatives of different clades occurred sympatrically: locality 190 (two clades), 191 (three clades) and 93 (two clades). Representatives of two mOTUs were found at a further 13 reference localities: 94, 95, 196, 206, 212, 214, 276, 277, 293, 295, 297, 301, 305, 368, and three at the locality 127 (Fig. 162). These localities were excluded from intrapopulation analyses.
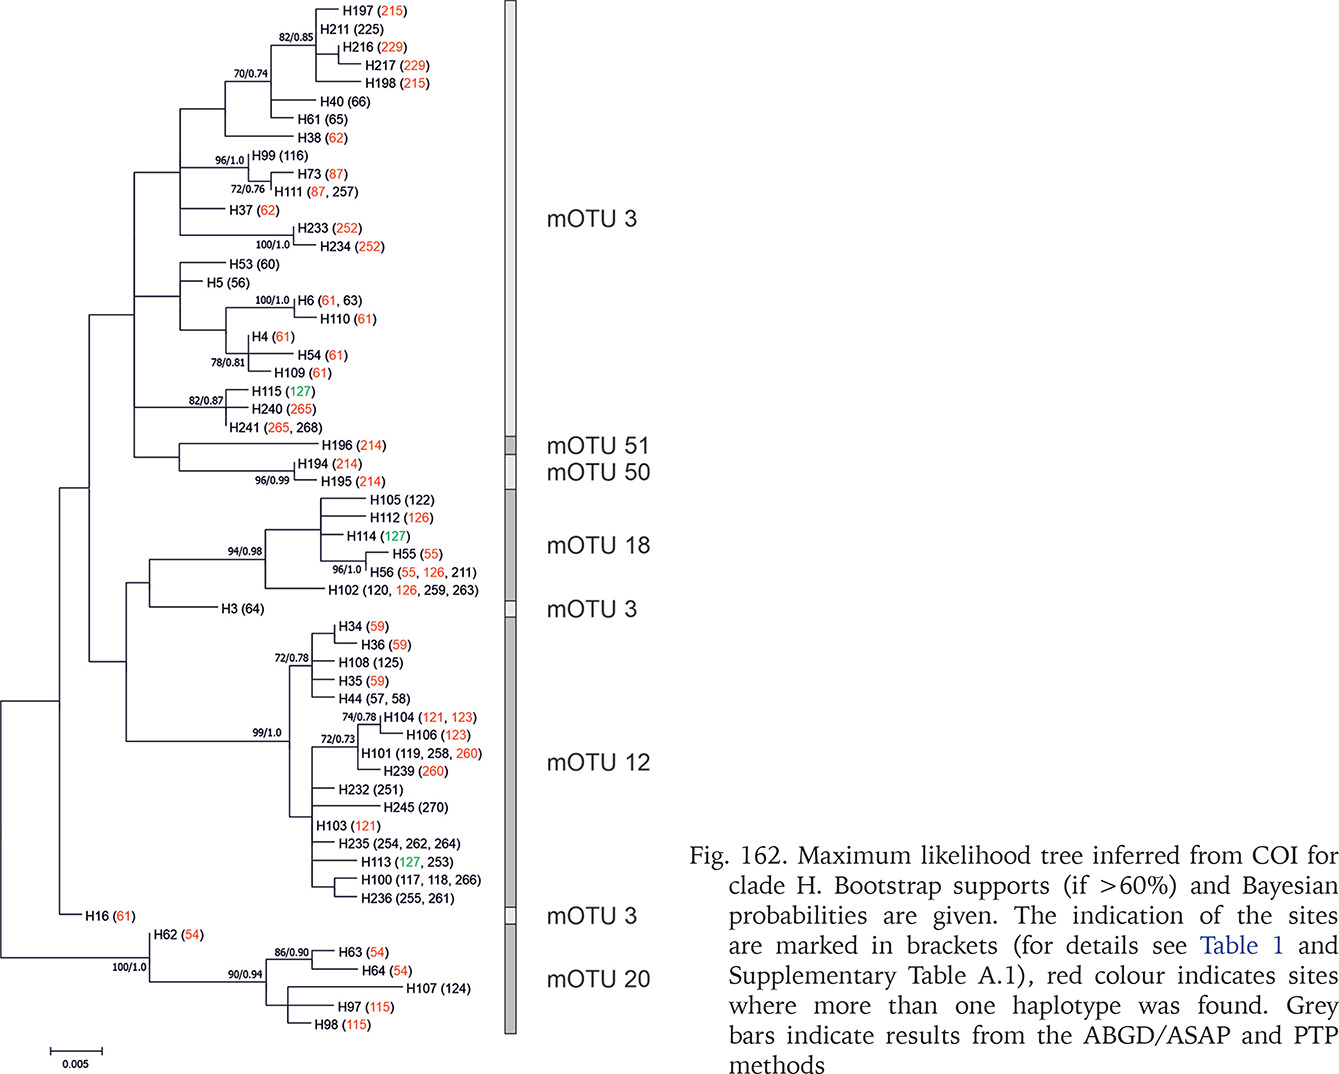
Fig. 162
Maximum likelihood tree inferred from COI for clade H. Bootstrap supports (if >60%) and Bayesian probabilities are given. The indication of the sites are marked in brackets (for details see Table 1 and Supplementary Table A.1), red colour indicates sites where more than one haplotype was found. Grey bars indicate results from the ABGD/ASAP and PTP methods
The genetic p-distances between clades were in the range 0.049–0.135 (Table 3). The intra-clade variability varied. Apart from clade P with only one haplotype, the lowest variation was found in clades: N (0.002), R (0.006), A (0.015) and C (0.015), the highest in clades: M (0.070), I (0.069), B (0.057), O (0.054) and E (0.050). Tables 4 and 5 present the genetic variability parameters for clades and mOTUs. The number of haplotypes varies from 1 (clade P) to 98 (clade E) and it is not correlated with the number of sequenced specimens, although the highest number we found in the richest in specimens (474 sequences) clade E, and most rich (190 sequeces) mOTU 2. Nucleotide diversity π was within the range 0.002–0.017. In general, haplotype diversity Hd were high, and π low (Table 5). A similar picture is seen in the polymorphic populations within clade A (Supplementary Table A.2).
Table 3
p-distances between Bythinella clades: below diagonal for COI, the within clade distances along diagonal (italic, bold), above diagonal for nuclear genes for selected clades
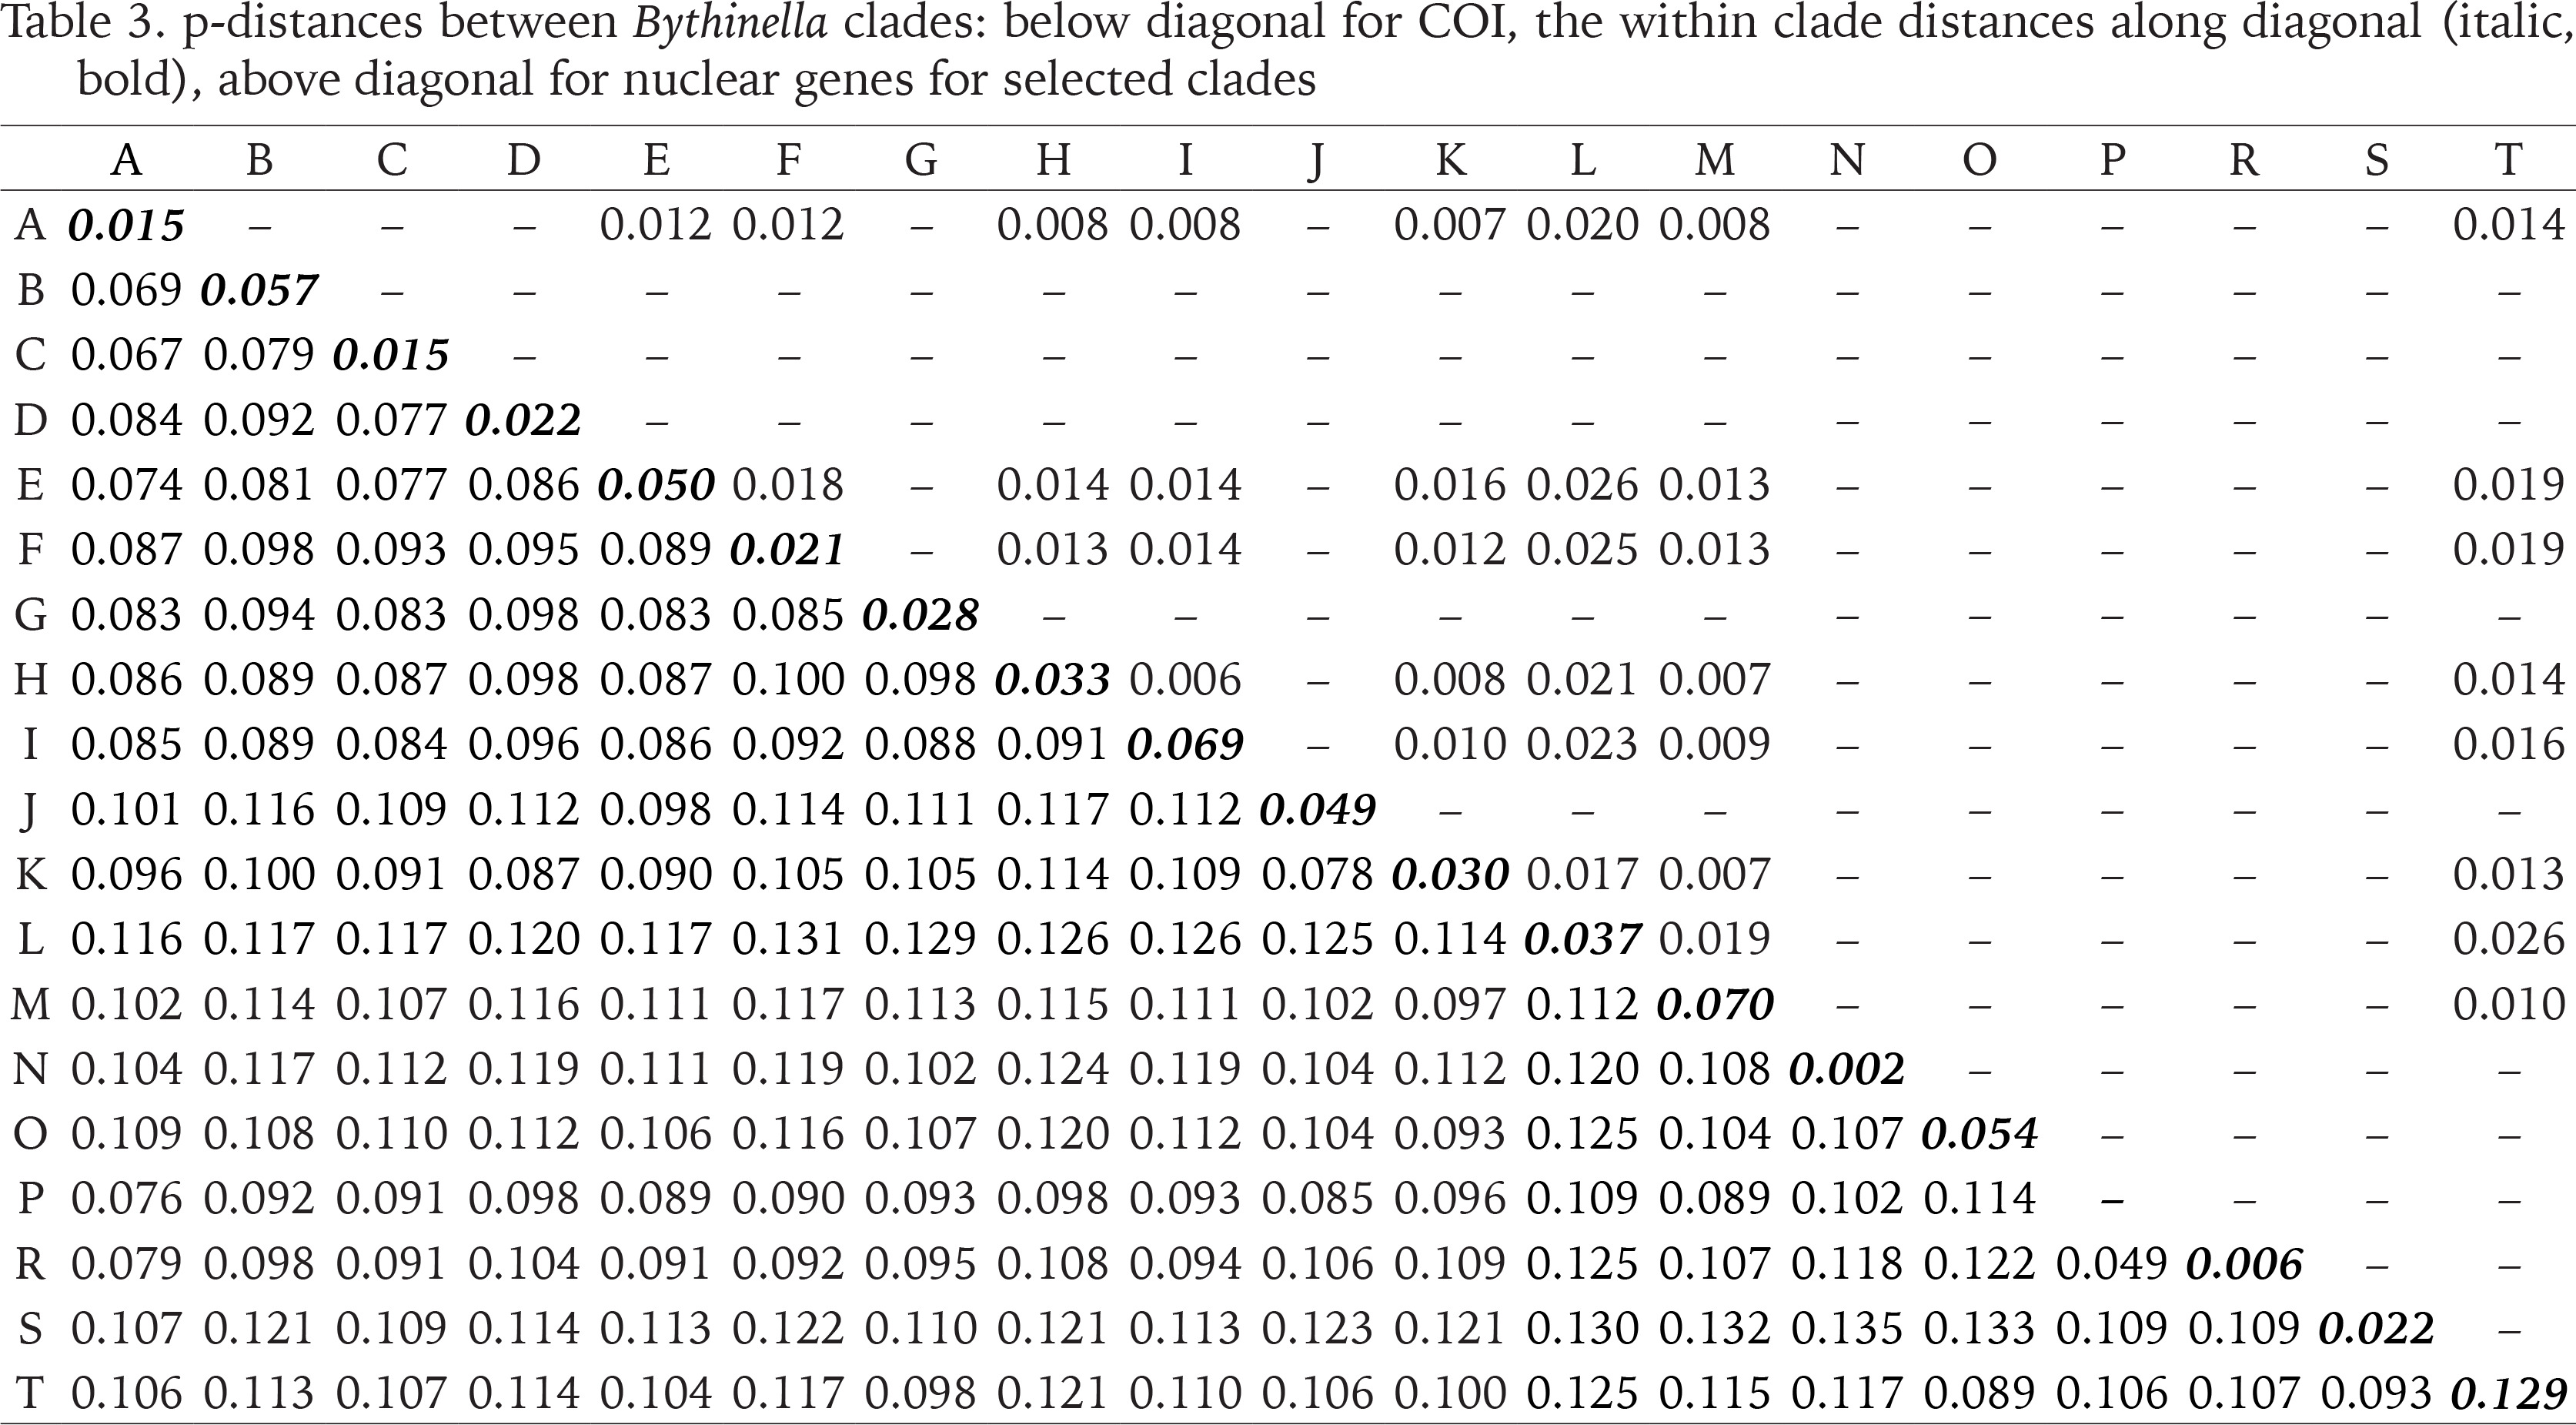
Table 4
Estimates of genetic diversity for clades of Bythinella (based on COI): number individuals for group (n), number of haplotypes (h), number of segregating sites (S), nucleotide diversity (π ± SD) and haplotype diversity Hd ± SD and test for demographic expansion accounted
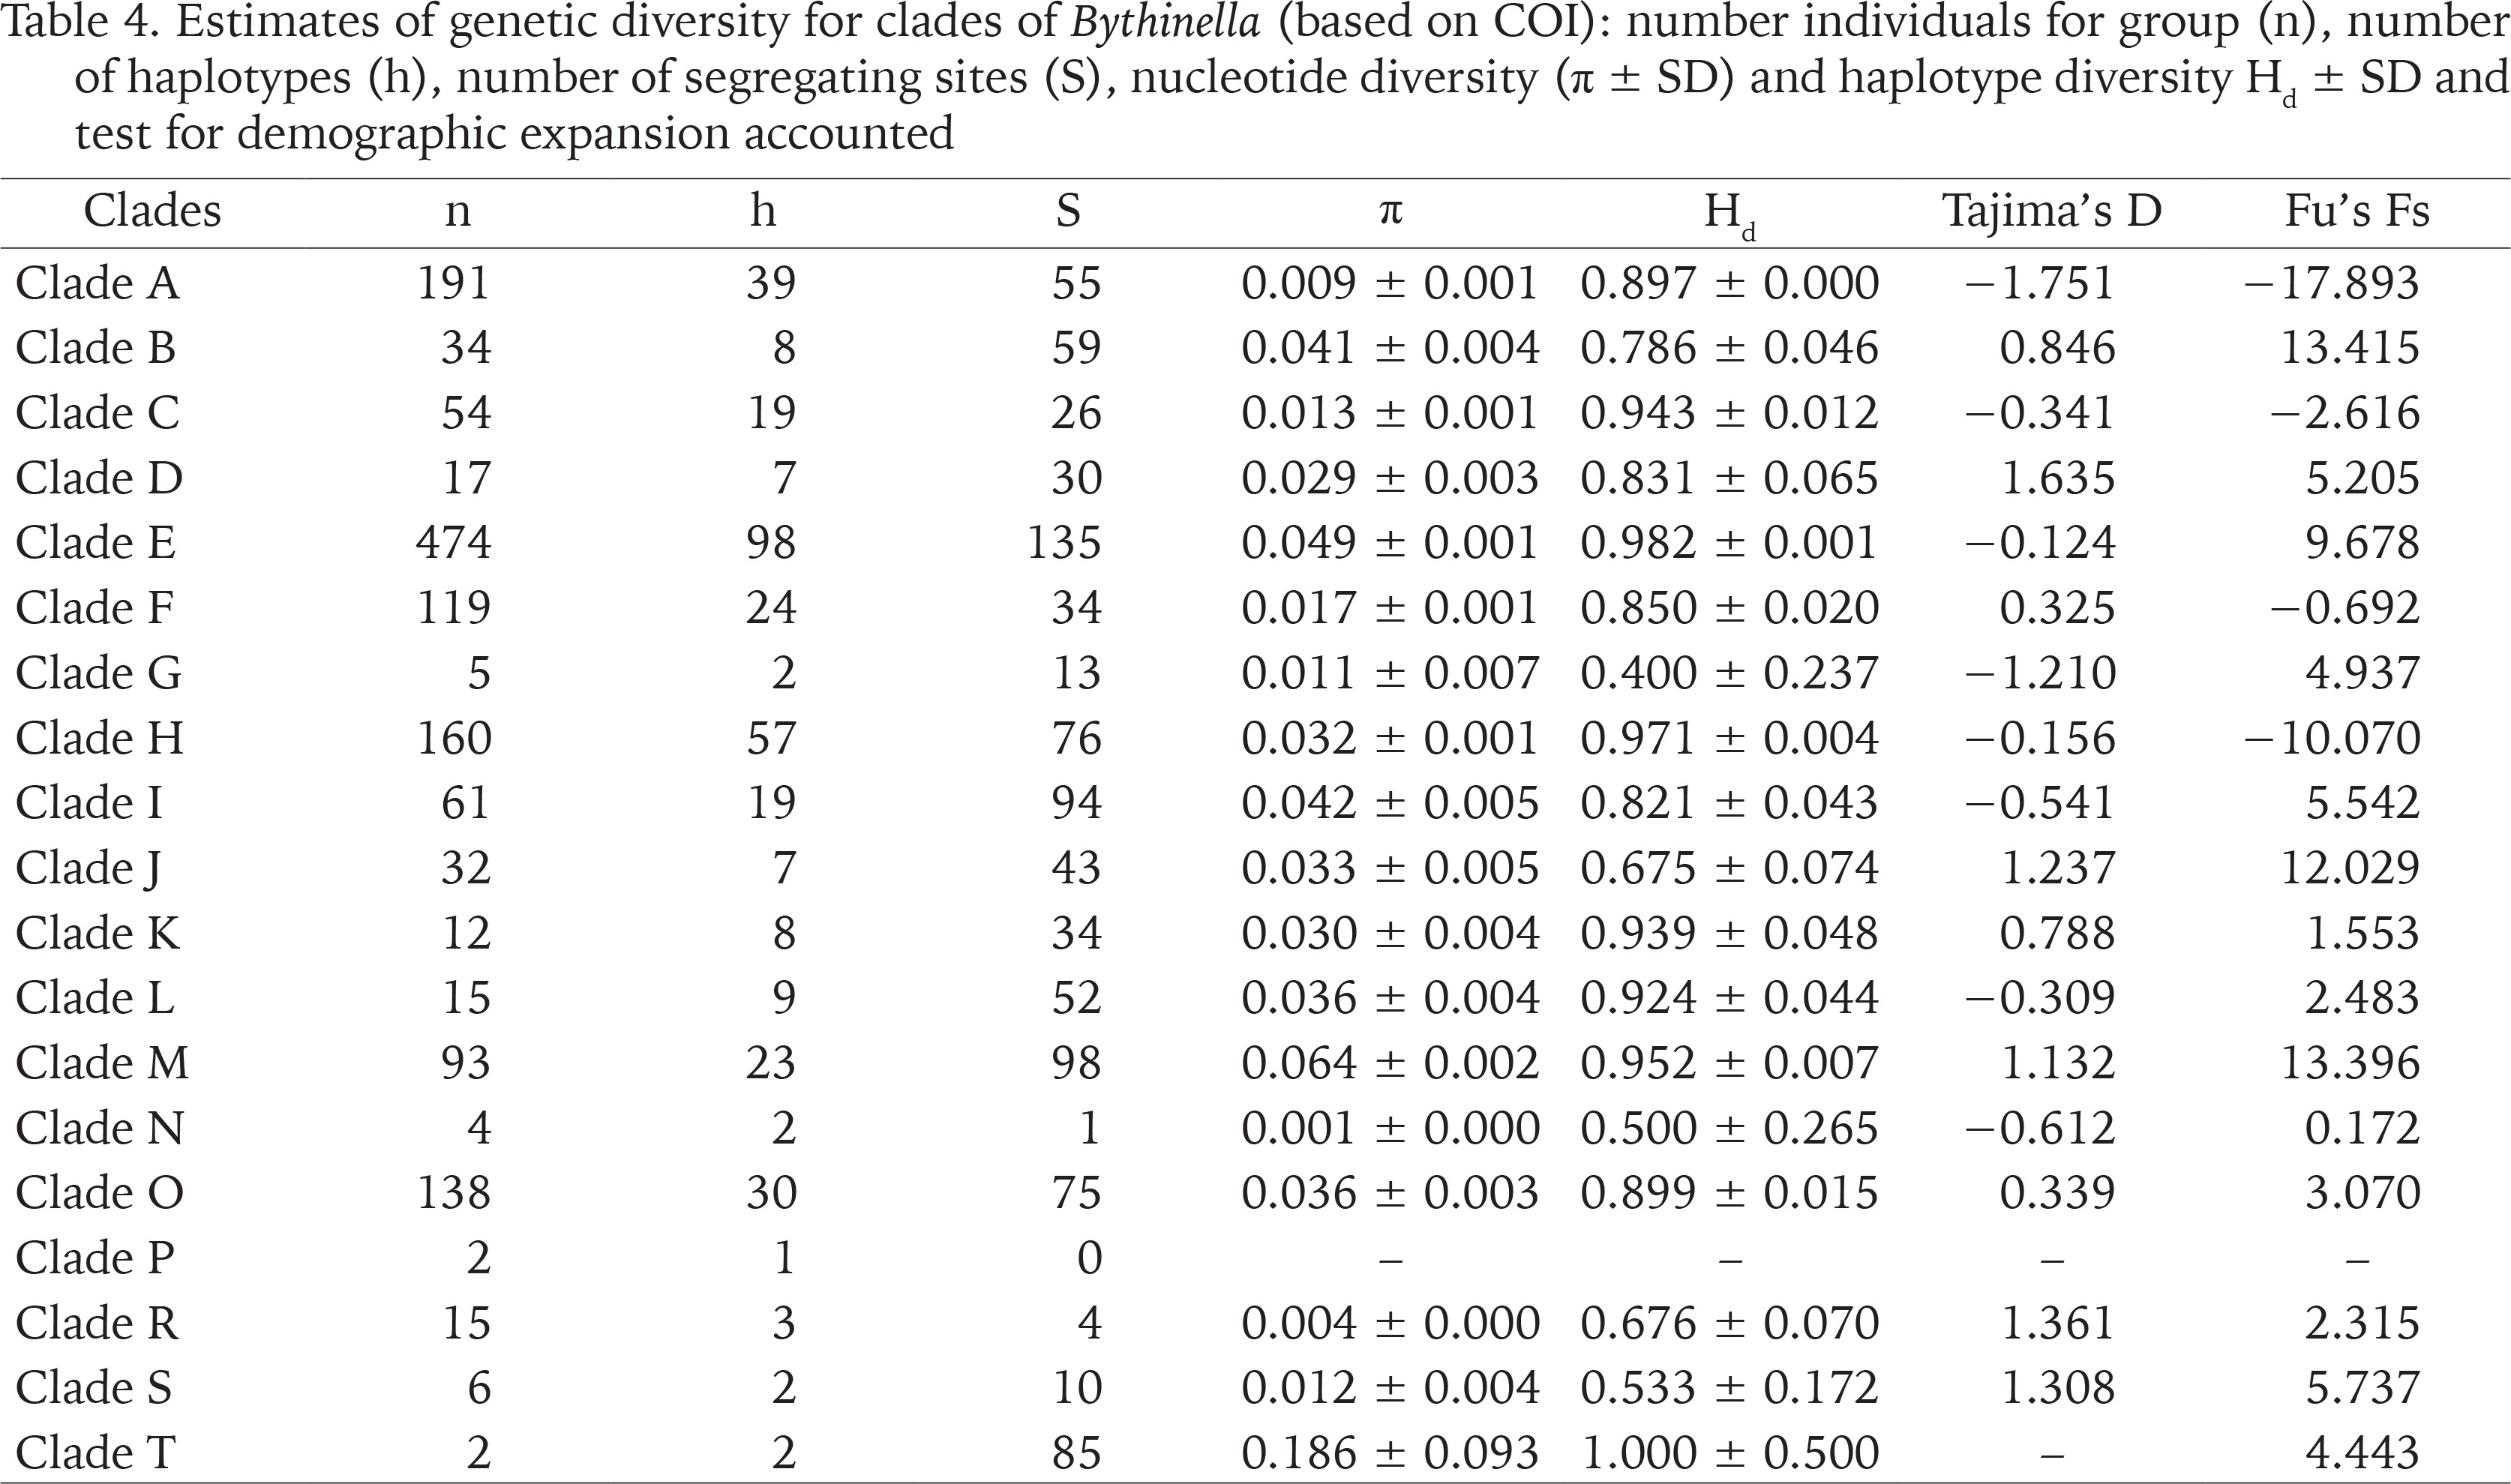
Table. 5
Estimates of genetic diversity for mOTU of Bythinella (based on COI): number individuals for group (n), number of haplotypes (h), number of segregating sites (S), nucleotide diversity (π ± SD) and haplotype diversity Hd ± SD and test for demographic expansion accounted
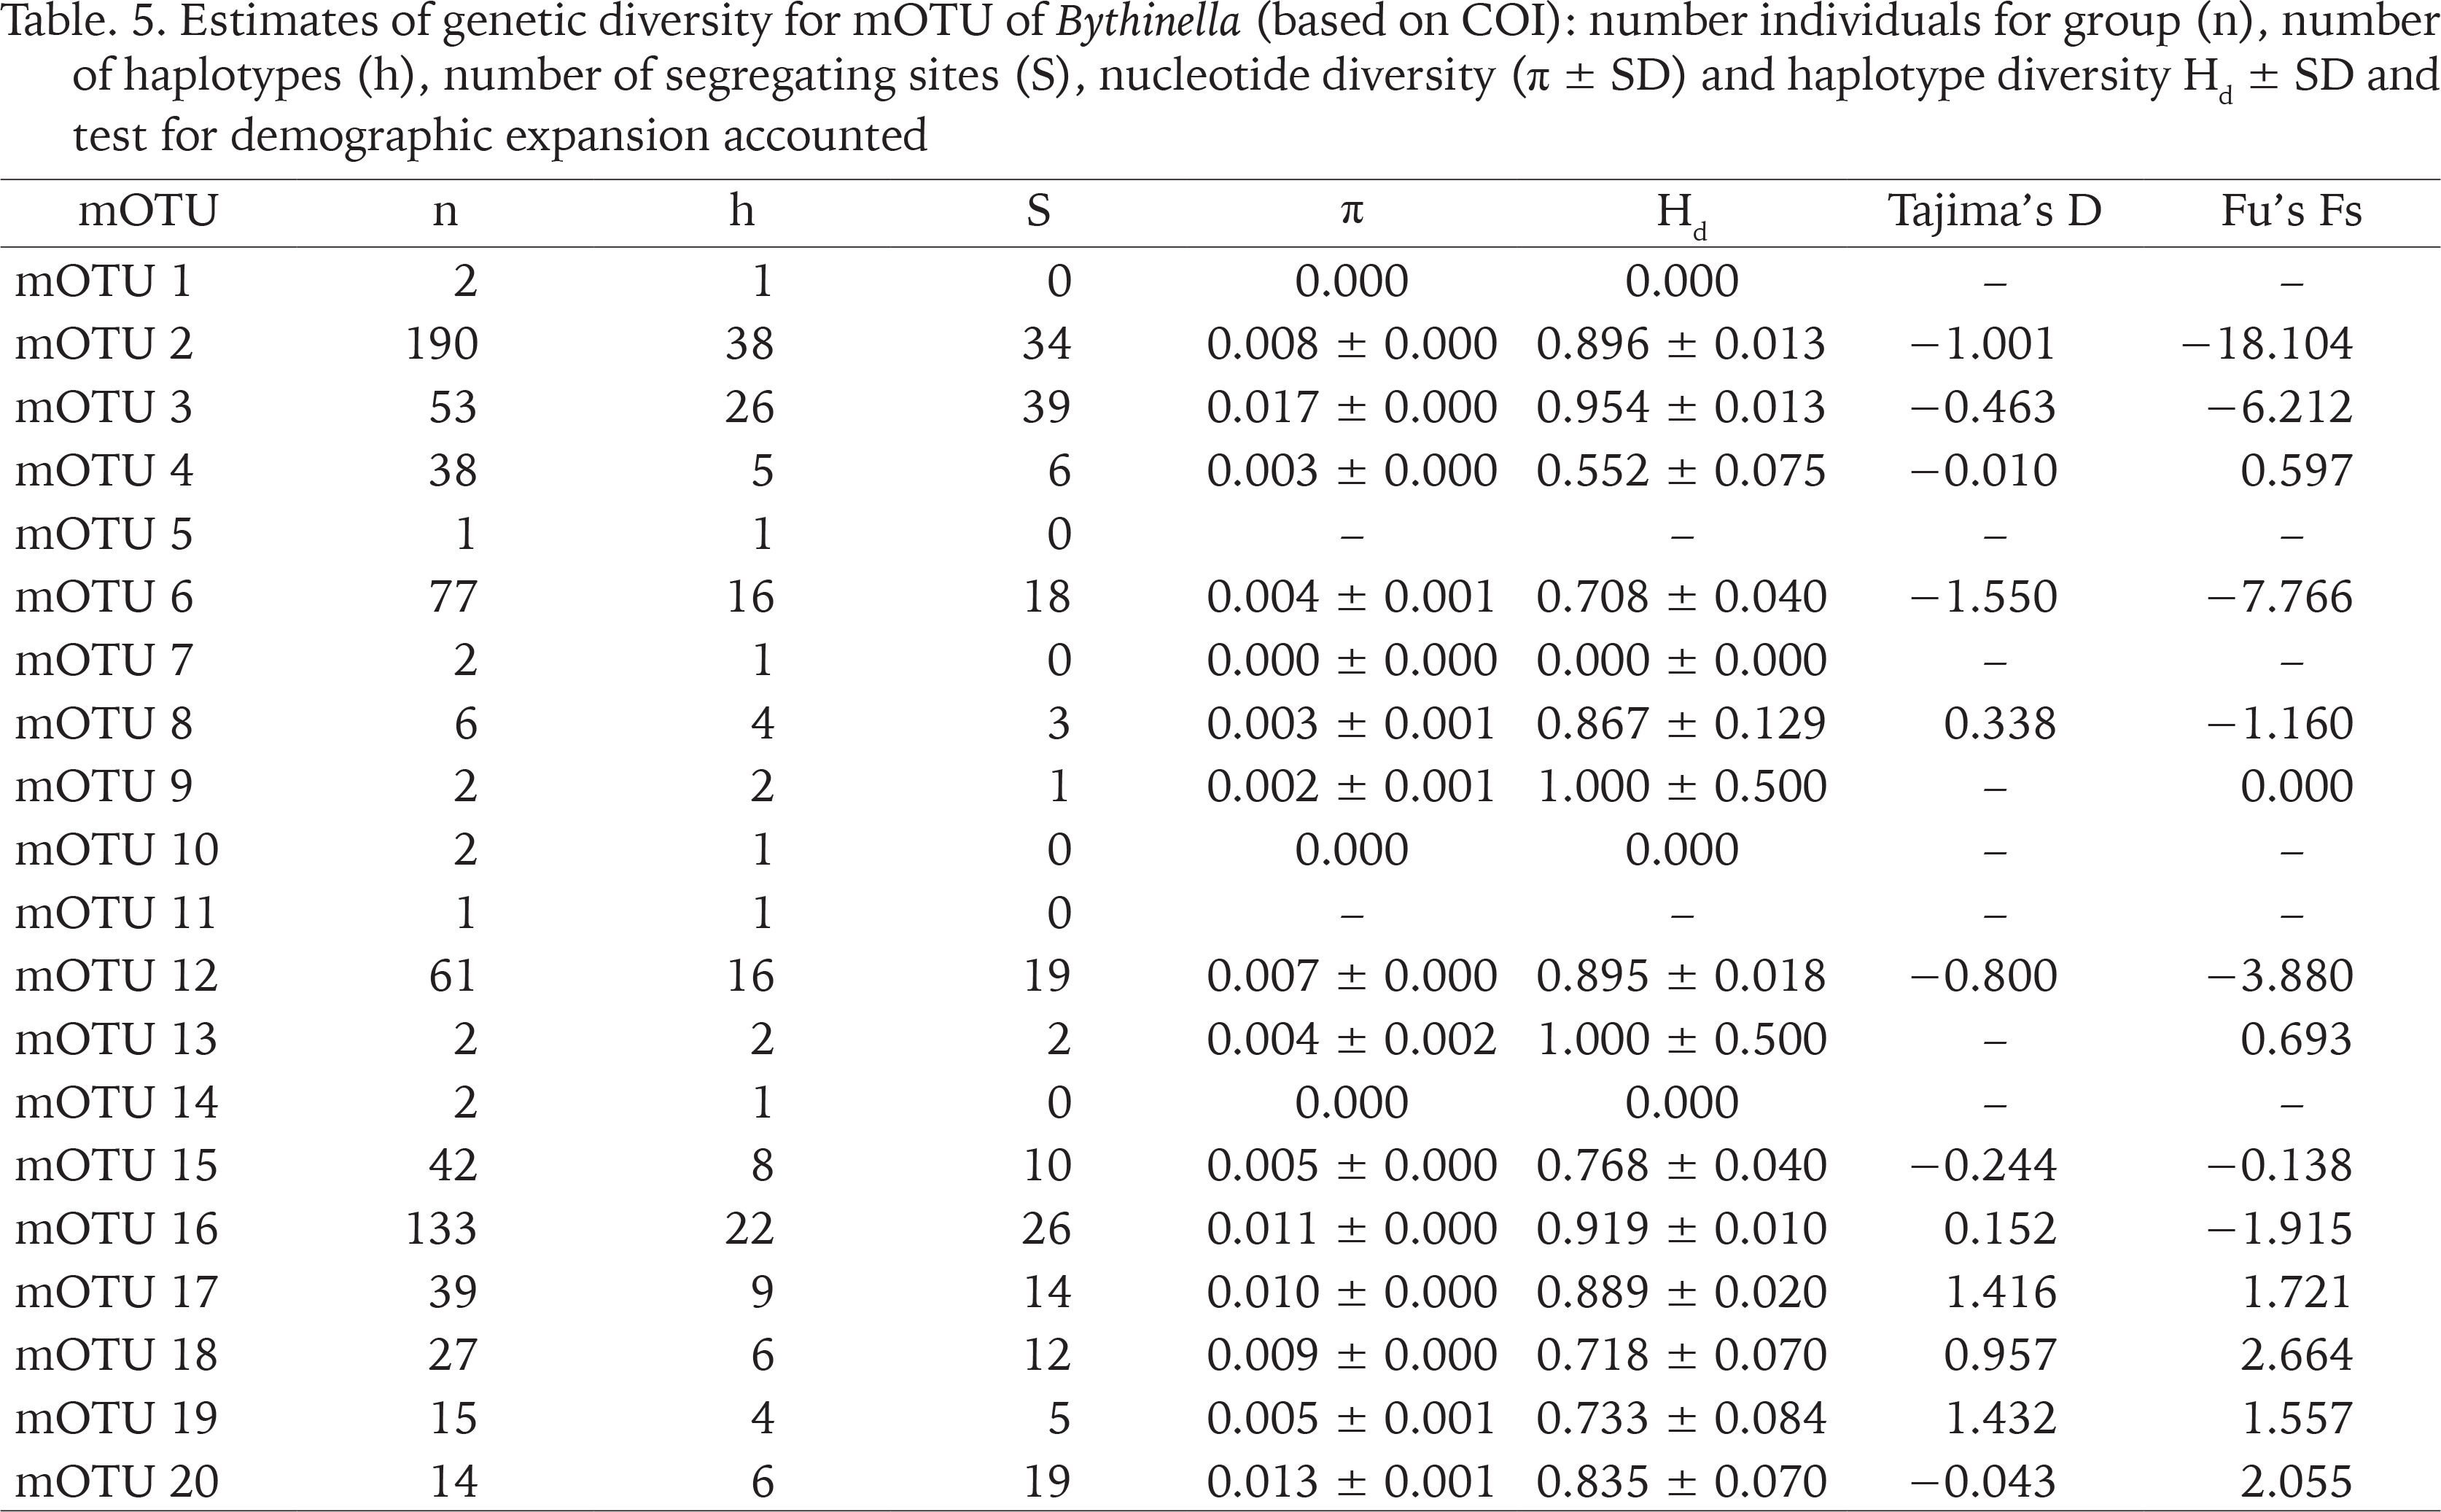
Values of Tajima test for mOTU are shown in Table 5.
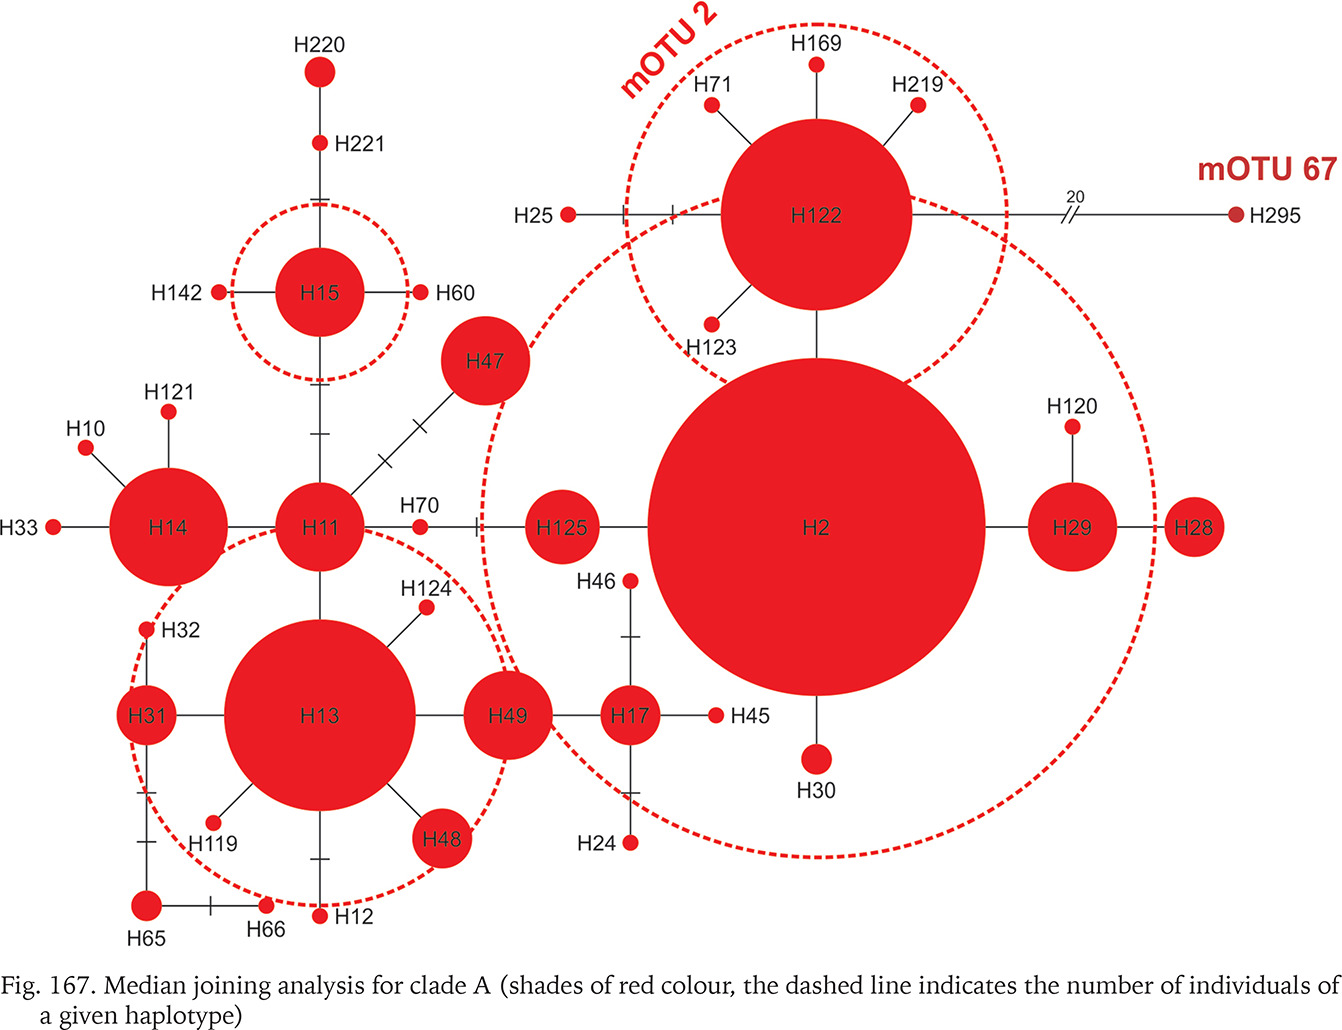
The geographic ranges of all clades are presented in Figs 163–165. Clades B, C, D, G, J, N, O, P, R and S are represented only by the sequences from the GenBank. Among the newly sequenced specimens, most of them belonged to clade A, one of the widest distributed geographically, covering Central Europe (Fig. 163). There were two mOTUs in this clade: 67 represented by Bythinella micherdzinskii, and 2 represented by B. austriaca (Fig. 163). Within clade A only a few subclades are well supported (bootstrap > 70%): Wierchomla in Poland (locality 13), three localities near Füzér in Hungary (localities 35, 37, 38), and two populations in Slovakia (Locality 40 – Španie Pole and locality 42 – Hrušovo). In the median joining tree for clade A (Fig. 167, shades of red colour) shows three haplotypes present in many specimens, while the other haplotypes are much less common, and the substitution number between the most distant haplotypes does not surpass 15, apart from the haplotype 295 (B. micherdzinskii). Between the neighbouring haplotypes the number of substitutions does not exceed three.
Fig. 163
Geographic range of clades A–E, colours and numbers indicate individual mOTUs belonging to clades
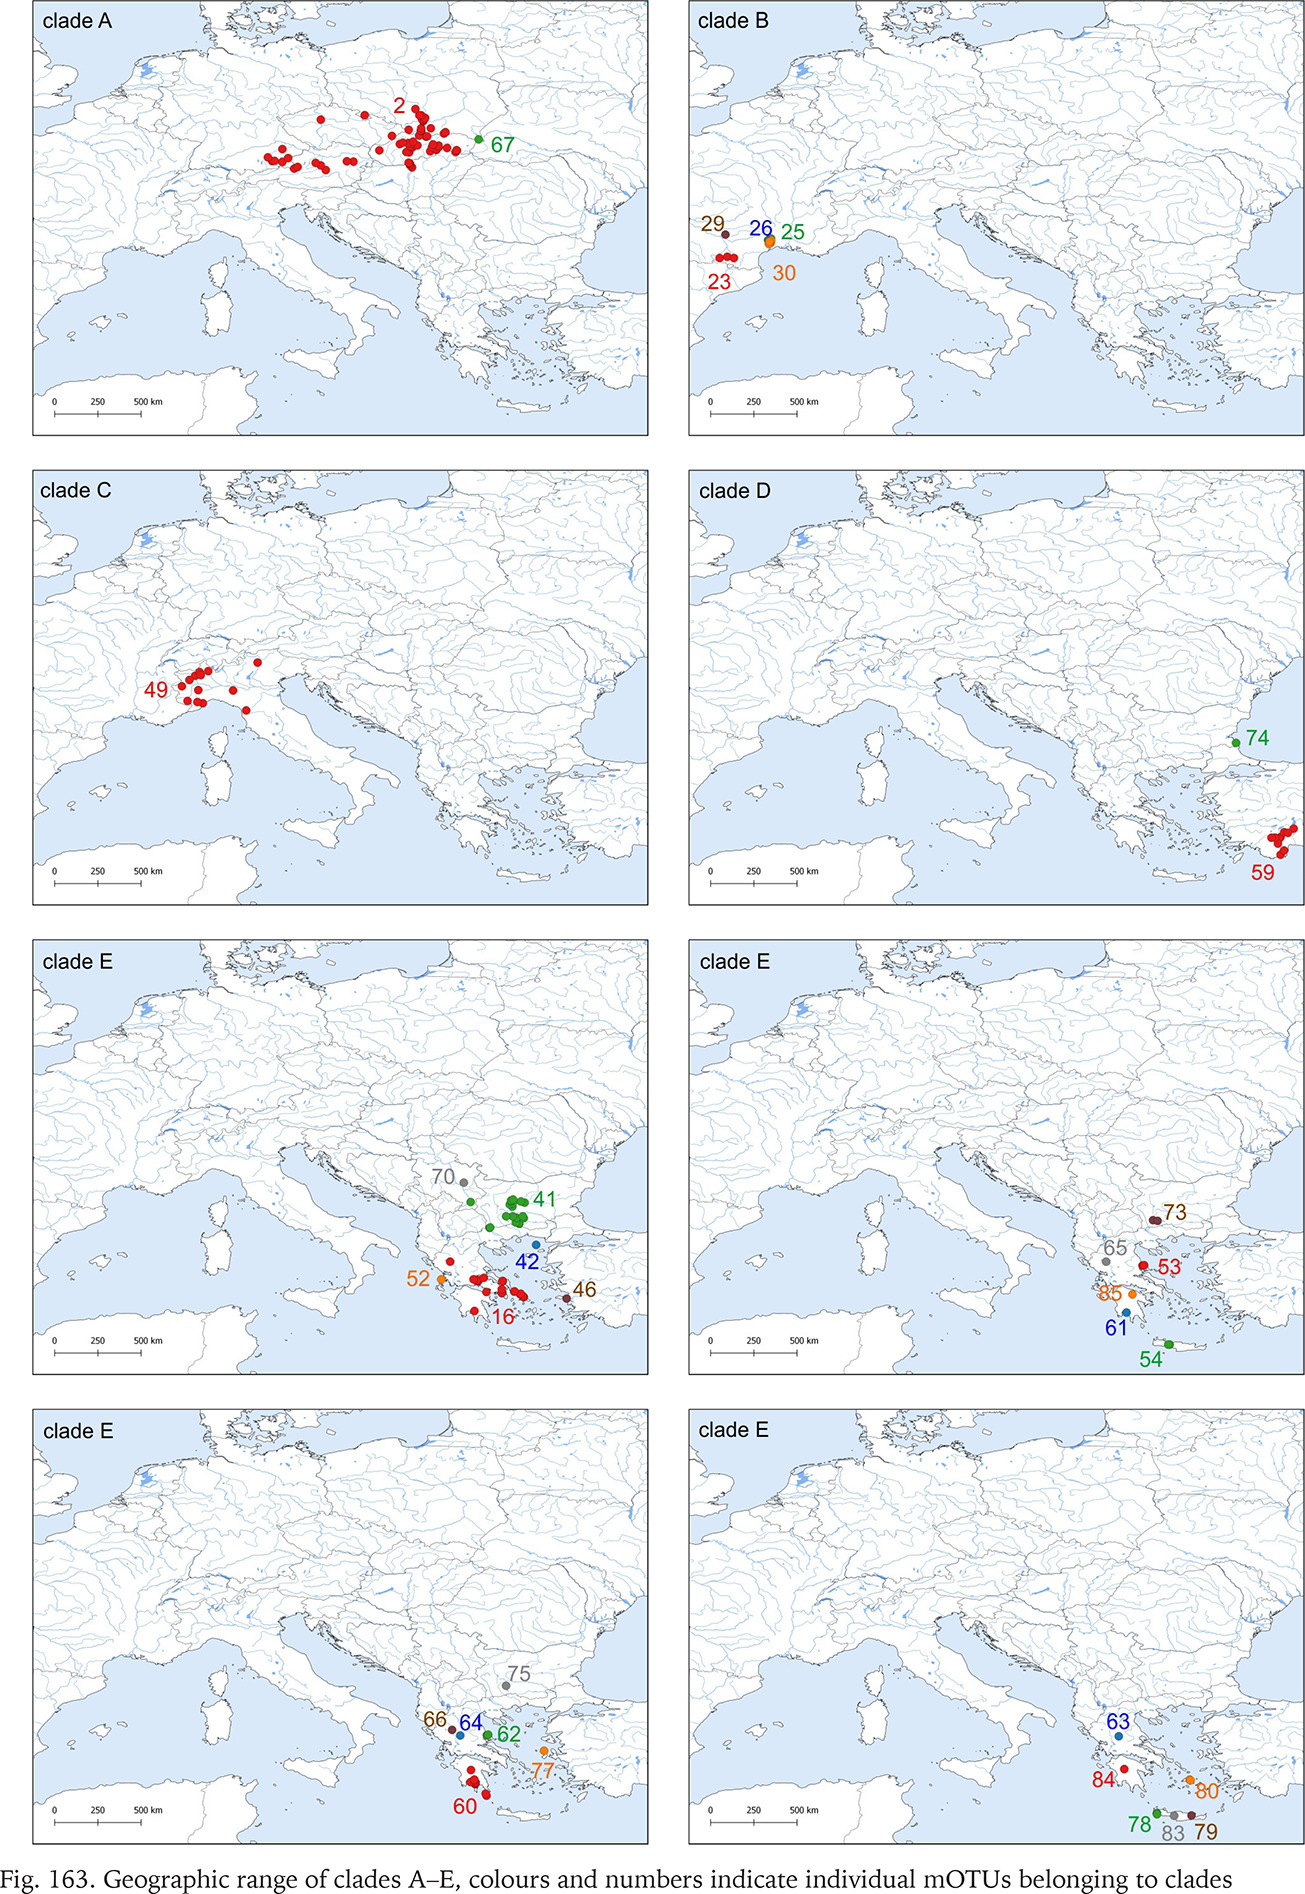
Fig. 164
Geographic range of clades F–L, colours and numbers indicate individual mOTUs belonging to clades
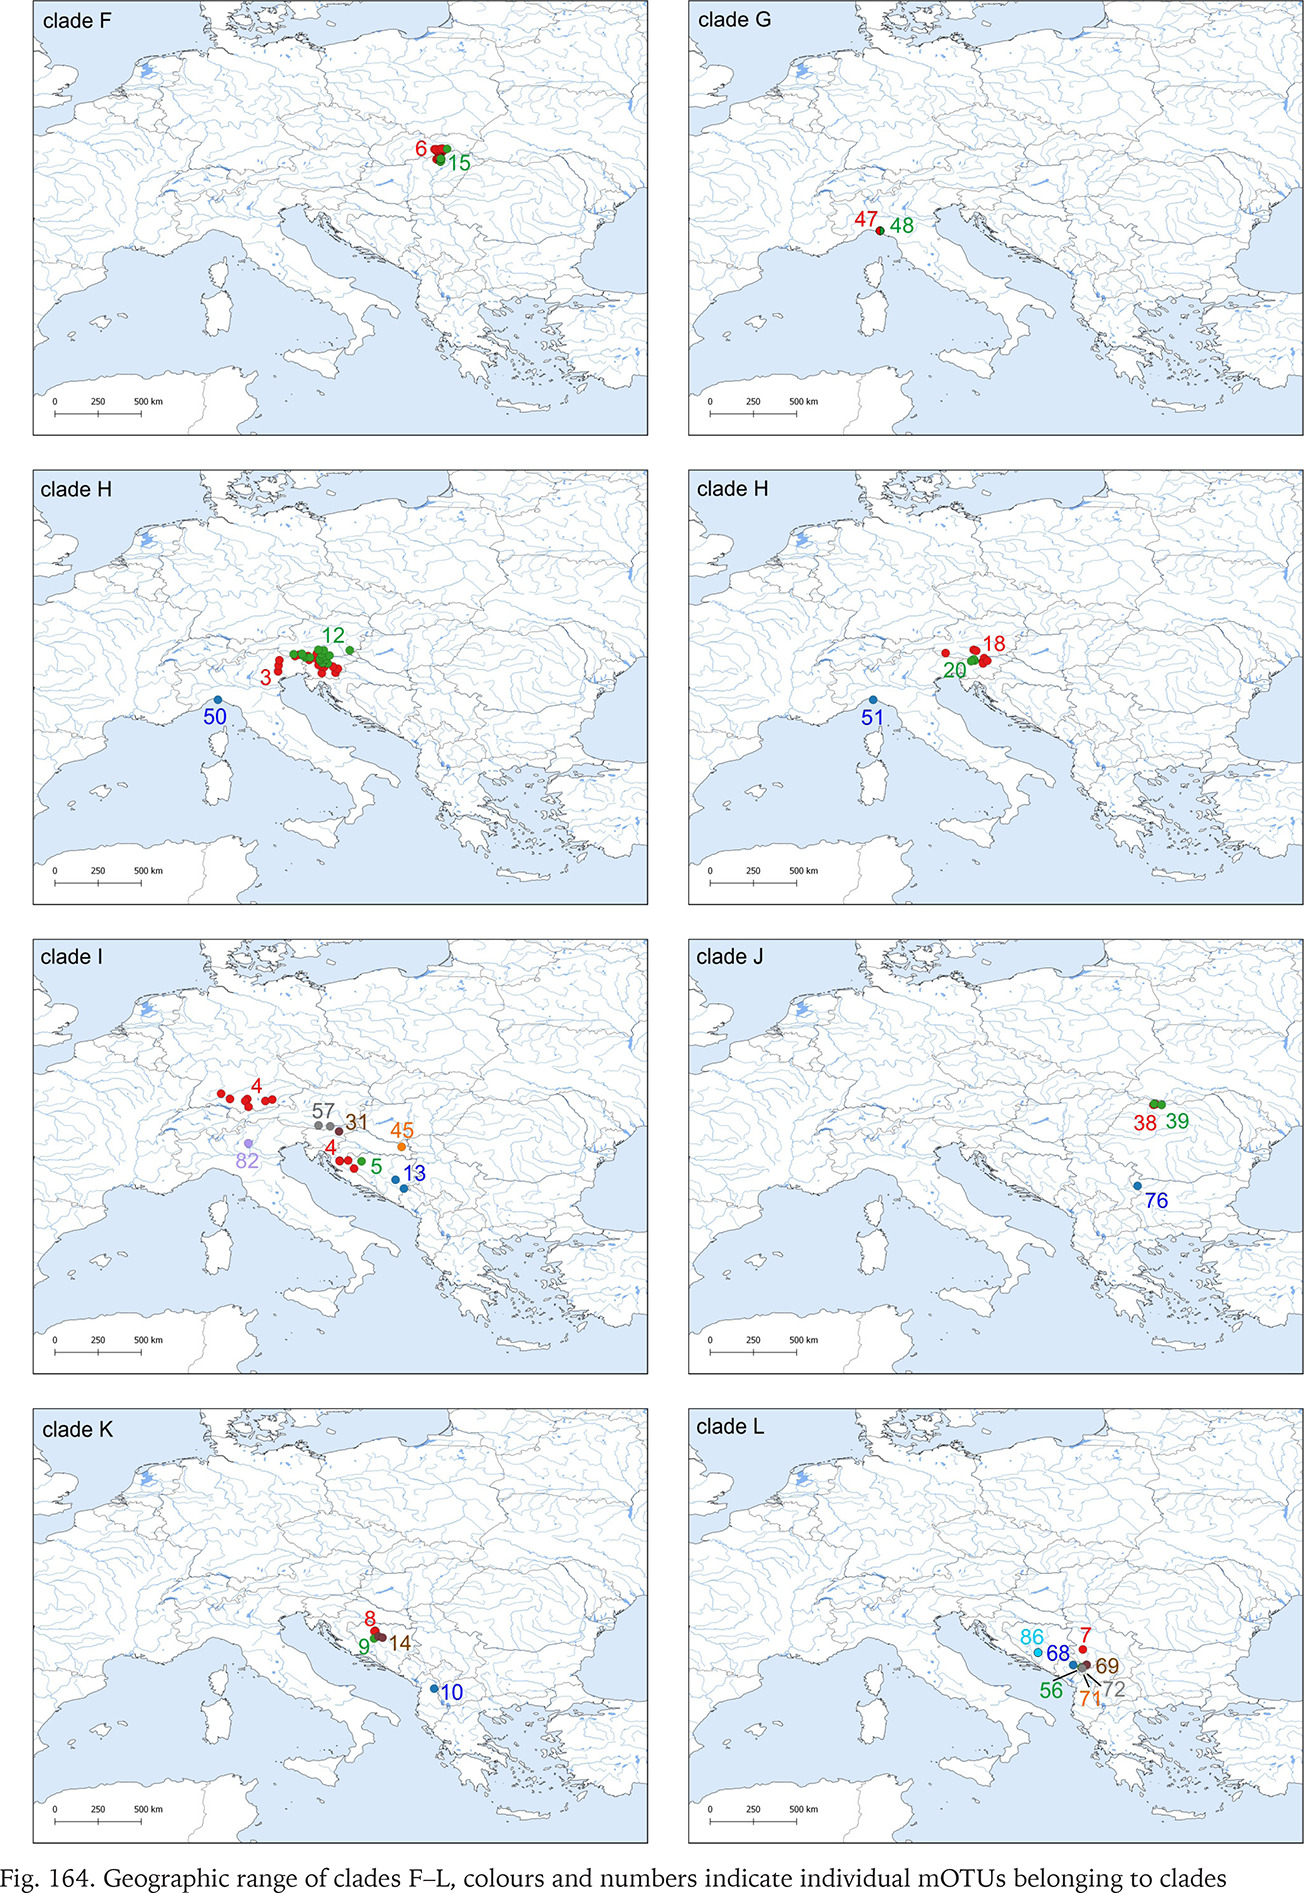
Fig. 165
Geographic range of clades M–T, colours and numbers indicate individual mOTUs belonging to clades
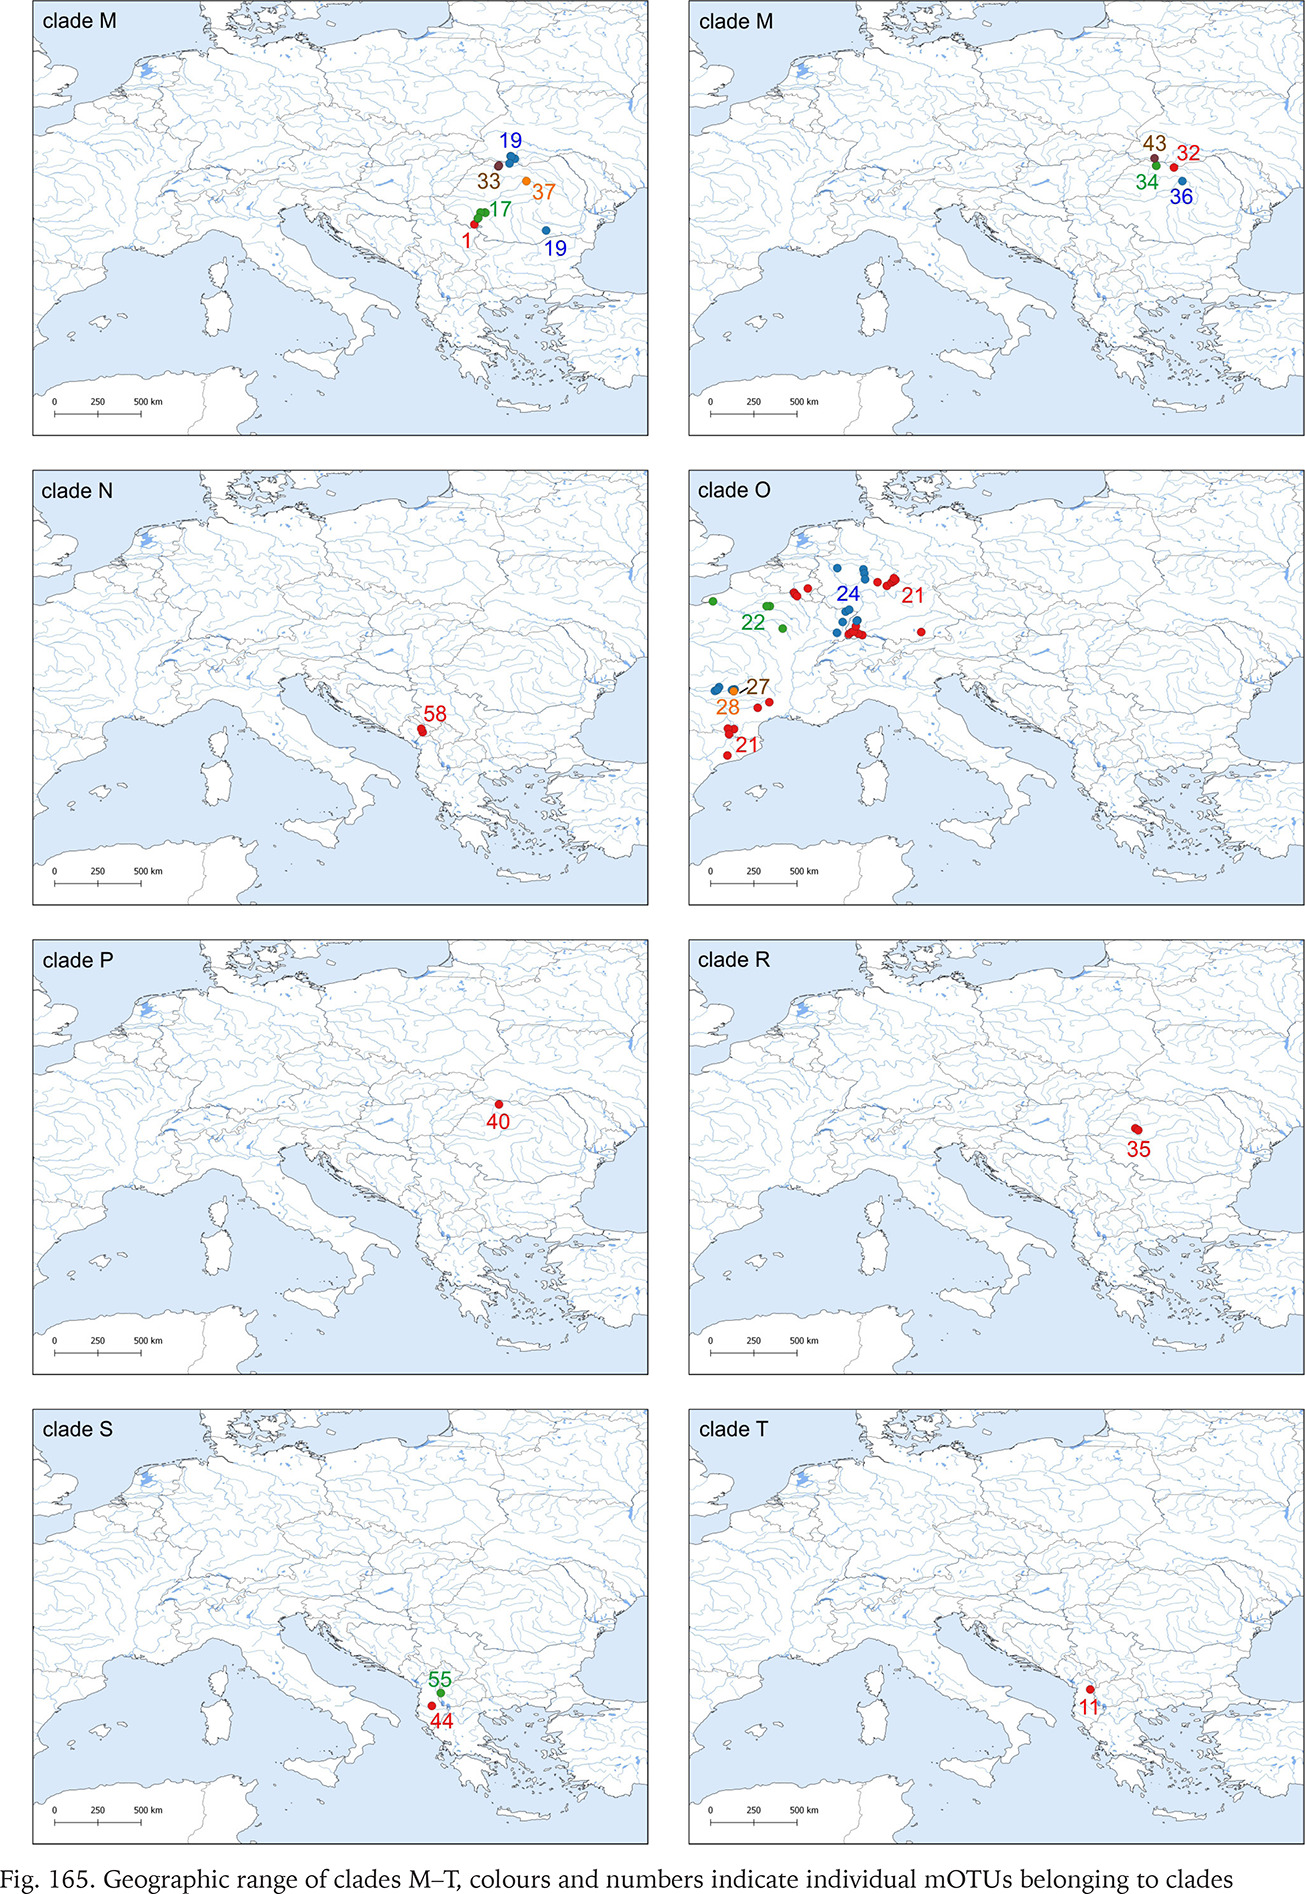
Fig. 166
Maximum likelihood tree inferred from COI for clade A. Bootstrap supports (if >60%) and Bayesian probabilities are given. The indication of the sites are marked in brackets (for details see Table 1 and Supplementary Table A.1), red colour indicates sites where more than one haplotype was found
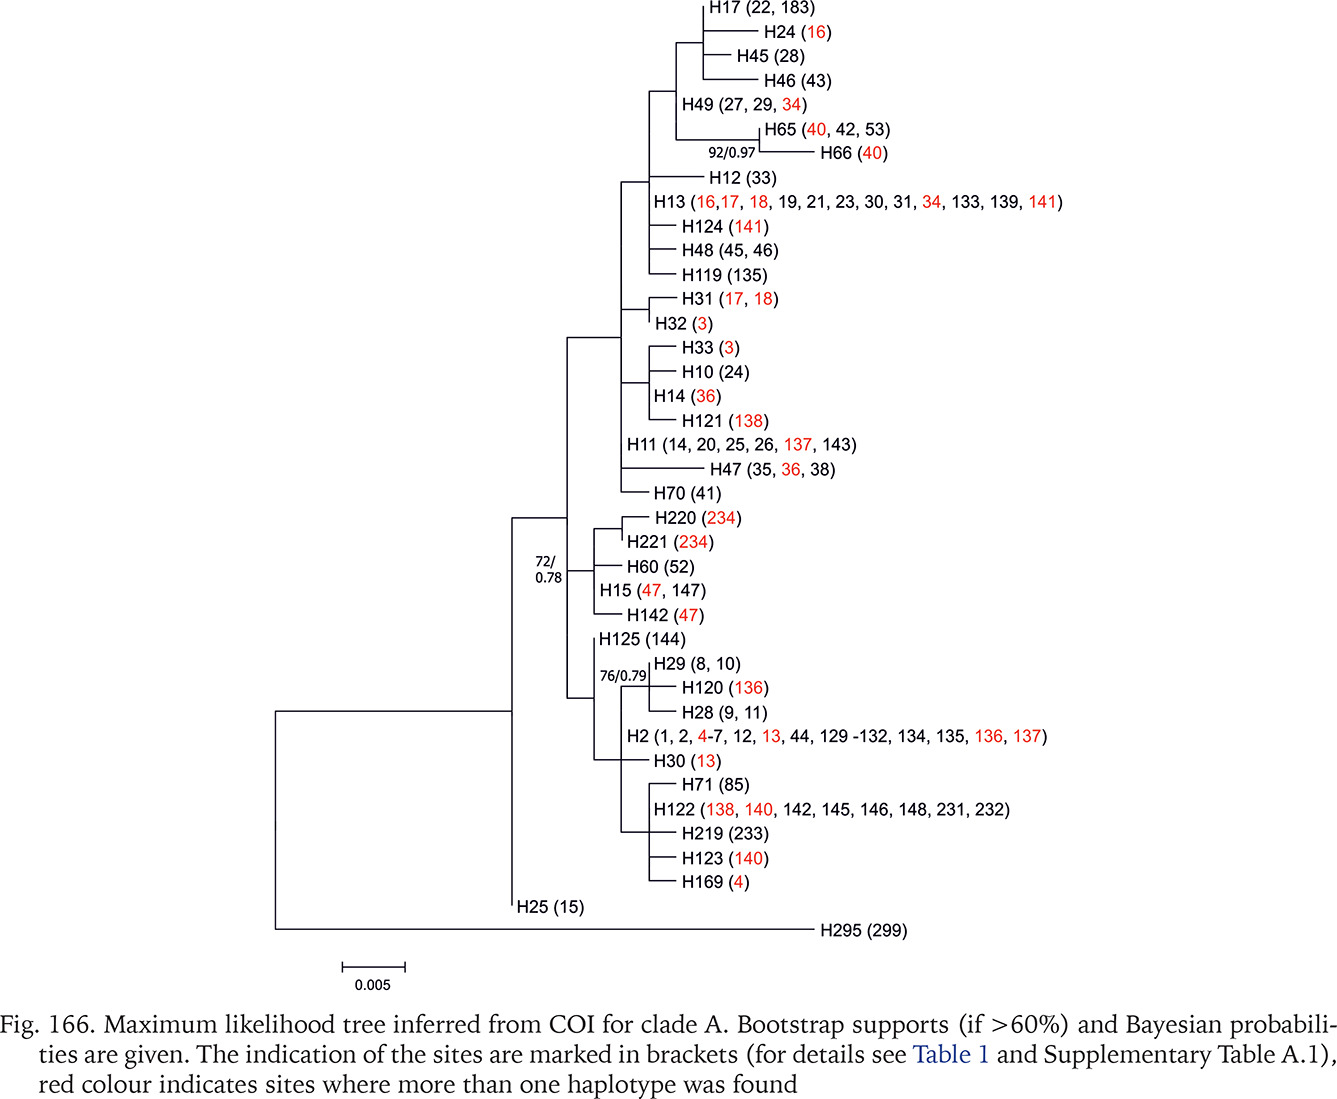
Fig. 167
Median joining analysis for clade A (shades of red colour, the dashed line indicates the number of individuals of a given haplotype)
Only two new sequences represent clade E, mOTU 16, from southern Greece (Fig. 163). In general, sequences of clade E are most diverse in Bythinella (π = 0.049 ± 0.0008; h = 98; Hd = 0,982 ± 0.0010; Table 4). Its geographic range expands from the island of Crete in the south to the Rtanj Mts in east Serbia.
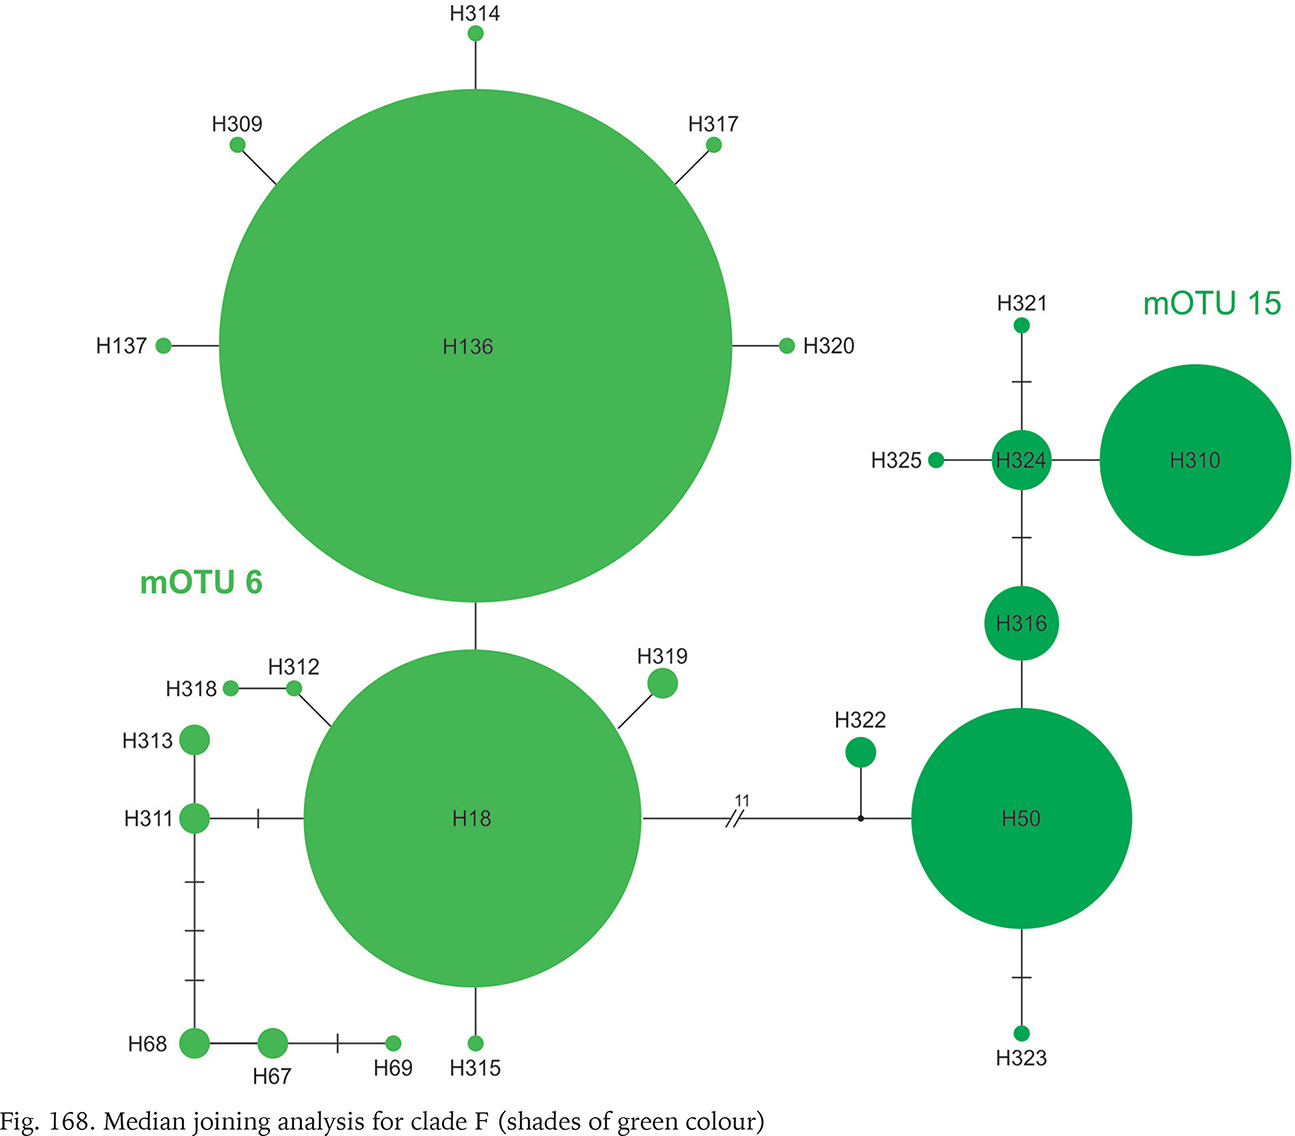
Clade F, known from a very restricted geographic range – on both sides of the border between Slovakia and Hungary (Fig. 164) – consisted of two mOTUs: 6 (B. pannonica) and 15 (B. thermophila), the genetic distance between them p = 0.034. The median joining tree (Fig. 168, shades of green colour) showed a rather characteristic pattern. The species differ in 11 substitutions.
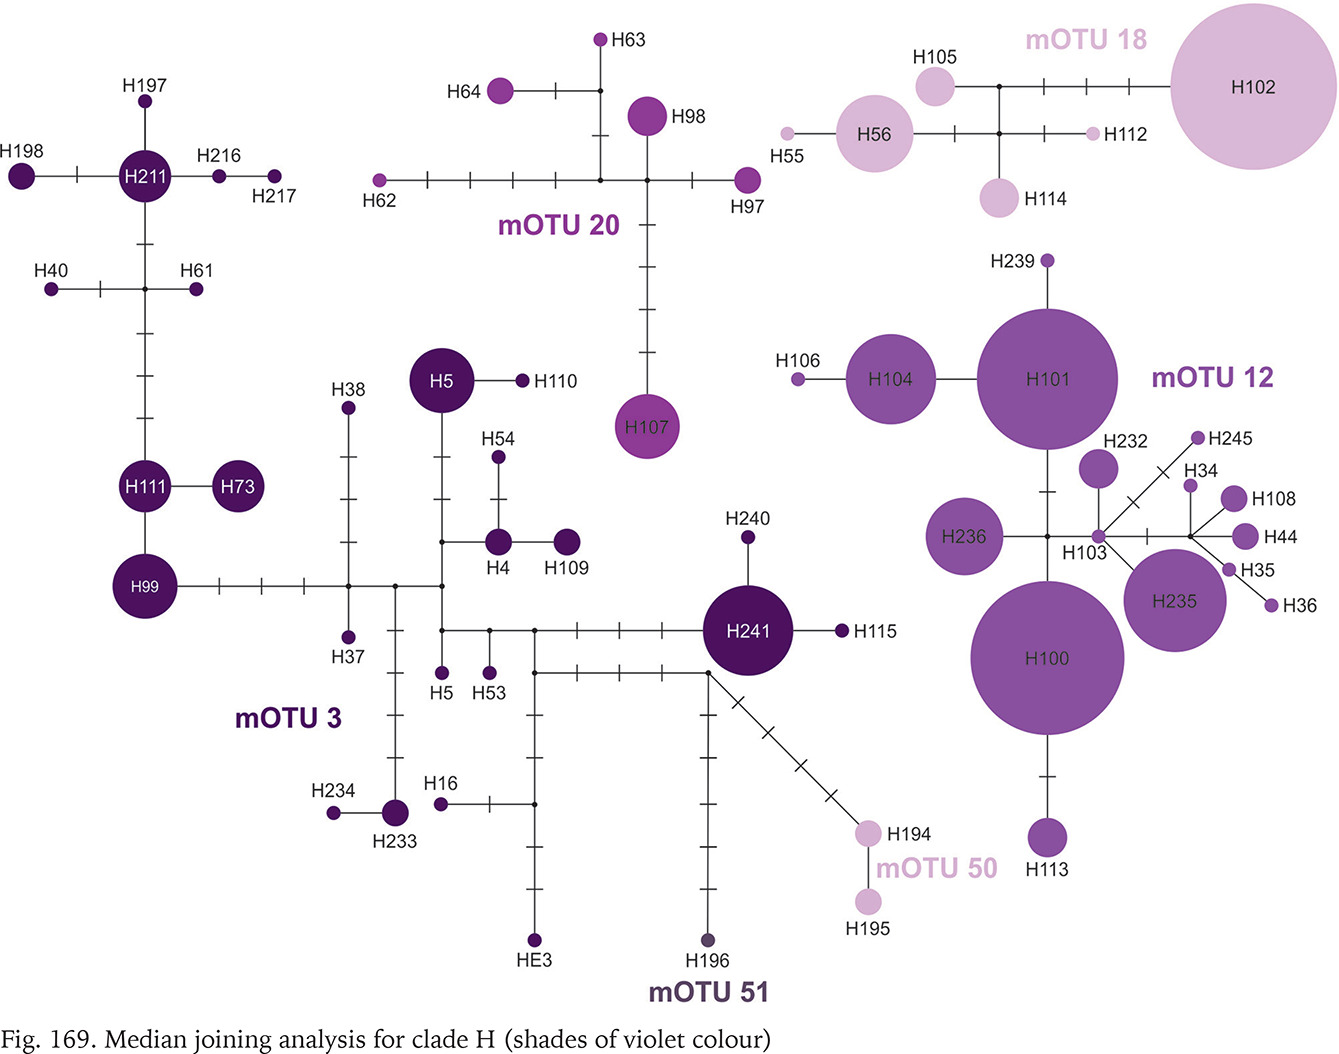
Clade H was second, after clade A, in the number of available sequences. It ranges from Austria to Slovenia and northern Italy (Fig. 164). The median joining tree (Fig. 169, shades of violet colour) clearly shows high variation within clade. The mOTUs differ as much, as the mOTUs 12, 18 and 20 we had to present separately. The remaining 3, 50 and 51 were presented together, and there are more than ten substitutions between them. In the particular mOTUs the variability was diversified, in 12, 18 and 20 did not exceed 12, but in 3 it was much higher. The number of substitutions between the most distant haplotypes approached 25.
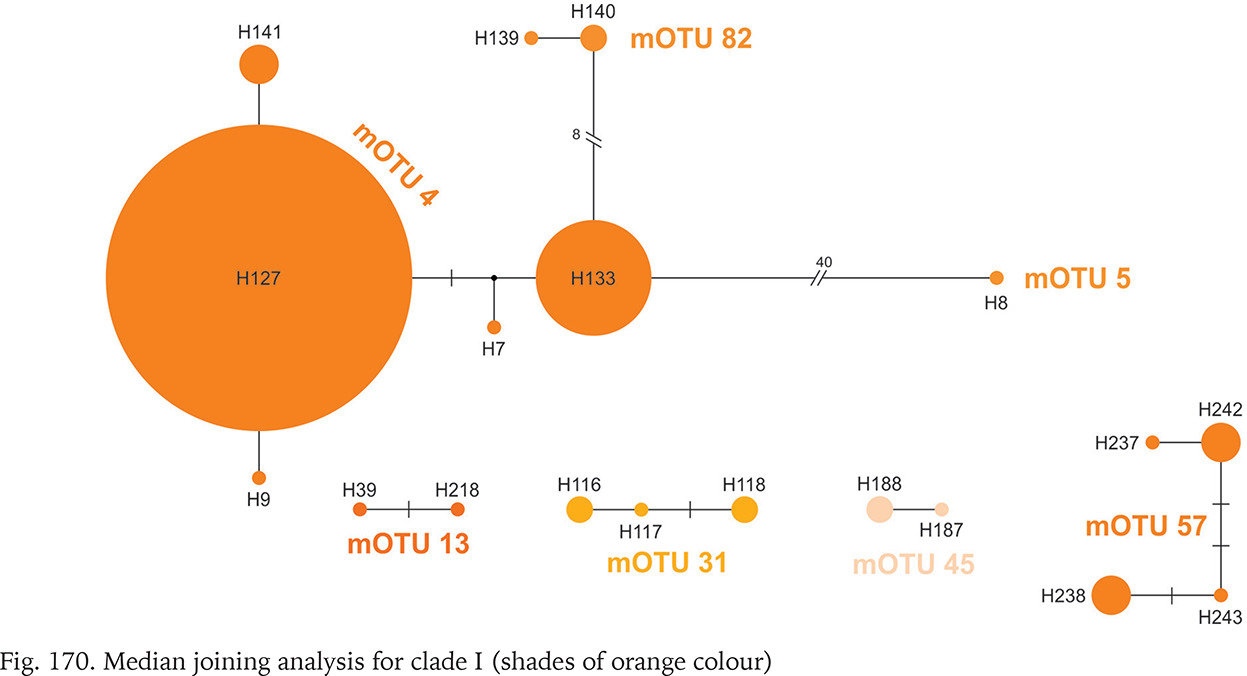
Clade I was distributed from southern Germany and northern Italy to southern Bosnia; one of its mOTUs were found in southern Germany and Slovenia (Fig. 164). There were seven mOTUs within clade (Fig. 170, shades of orange colour) differing in many substitutions. Most of the mOTUs present a few haplotypes in a few sequences. Only mOTU 4 consists of two haplotypes, differing in three substitutions, and represented in many sequences, the other haplotypes are less common. The most numerously represented haplotype 127 was found in Germany, and the also numerous haplotype 133 in the Balkans, mOTU 4 differs in eight substitutions from mOTU 82.
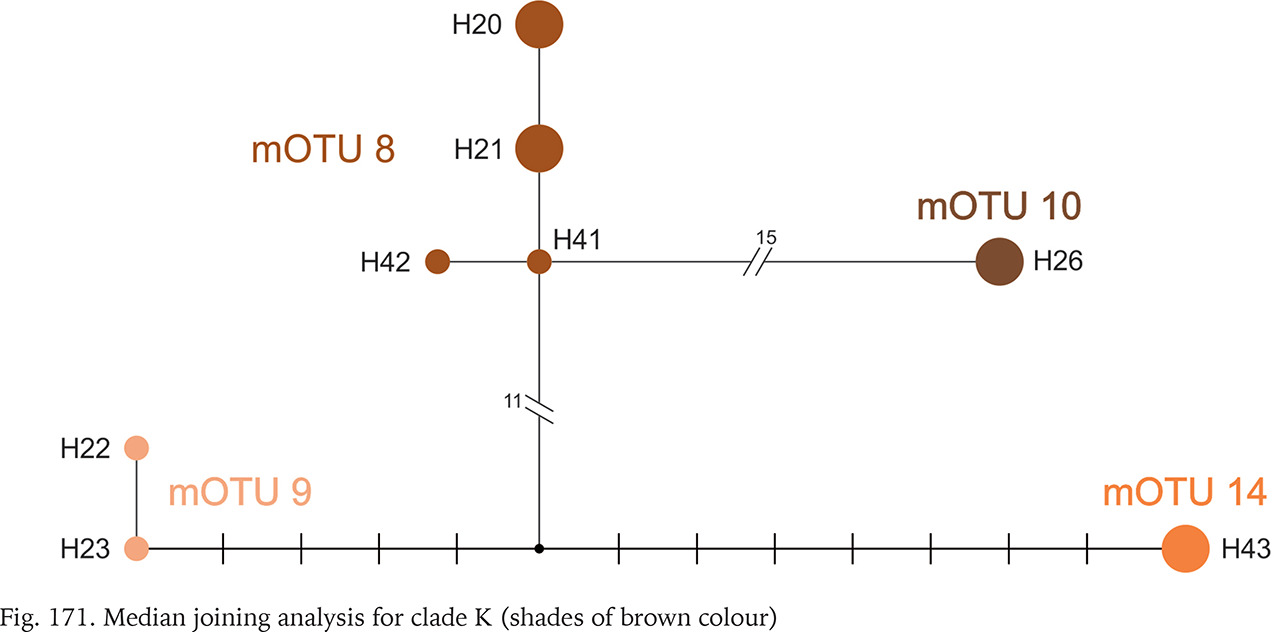
All the sequences grouped in clade K are new. Three mOTUs we found in northern Bosnia and Herzegovina, the fourth one – in Albania, about 400 km away from the others (Fig. 164). The mOTUs differ in more than twelve substitutions. Only mOTU 8 is represented by four different haplotypes (Fig. 171, shades of brown colour).
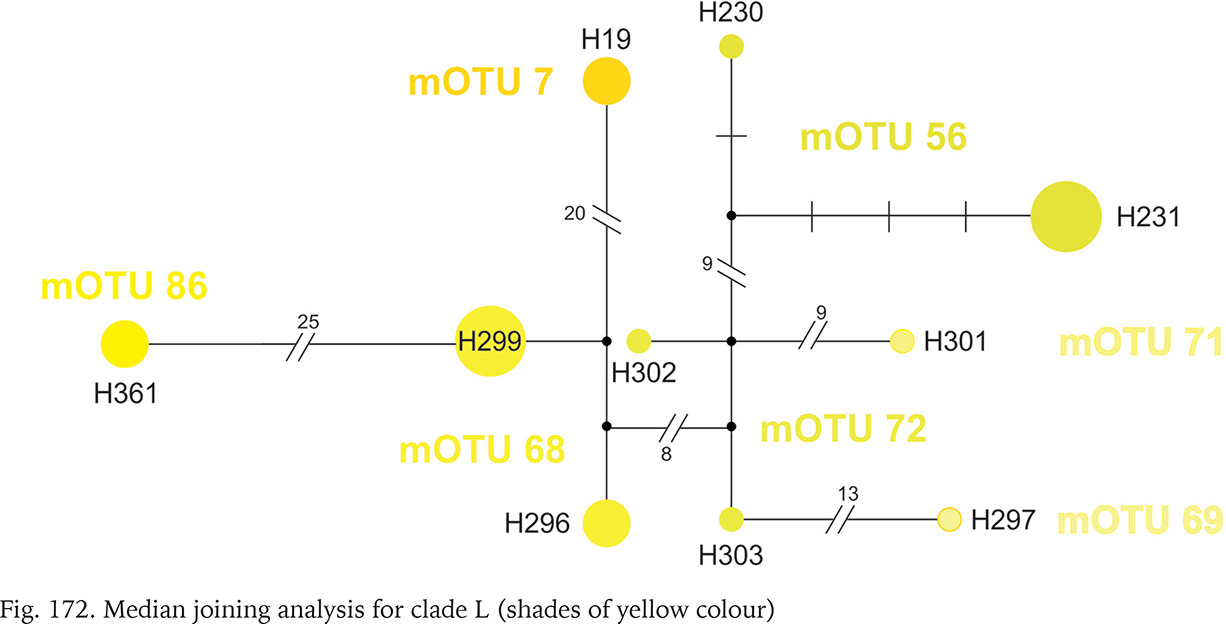
Within clade L, whose geographic range was narrow (Fig. 164), around the border between Montenegro, Serbia and Croatia, seven mOTUs were found: six including the sequences from GenBank, and one representing the specimens sequenced in the present study, from the population geographically most distant (about 200 km) from the others belonging to this clade. In each of the seven mOTUs there was one or two haplotypes, and the substitution number between the mOTUs approached 25 (Fig. 172, shades of yellow colour).
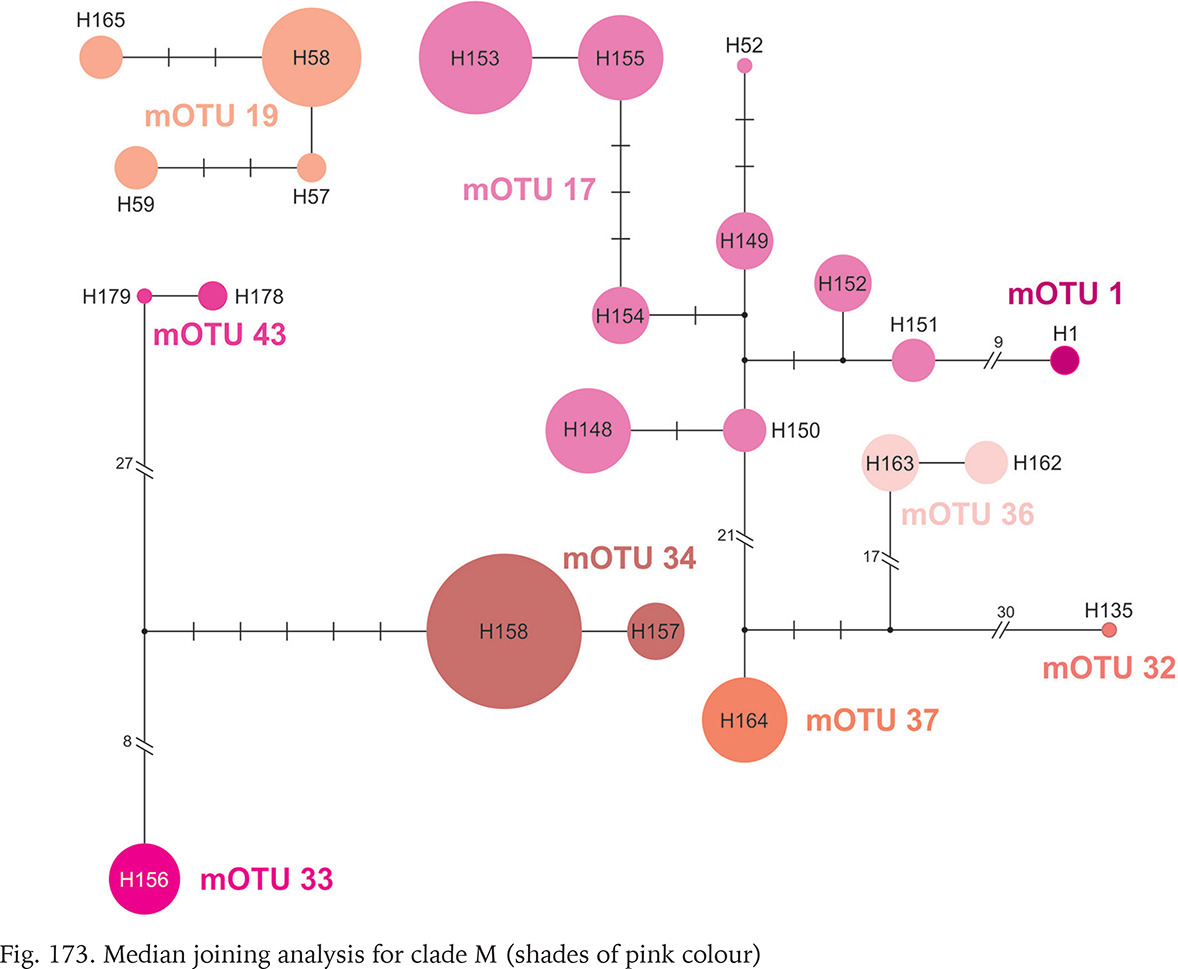
Clade M occurred in the most of Romania and South Ukraine (Fig. 165). Apart from mOTU 19, found in southern Ukraine and southern Romania, within a range of 450 km, the other mOTUs belonging to this clade have restricted geographic ranges. Within clade there are three markedly distinct phylogenetic lines, but within the mOTUs no more than four substitutions were found (Fig. 173, shades of pink colour).
The single sequence of the specimen collected in Albania (Fig. 165), representing the distinct clade T, is noteworthy. BLAST showed its closest relationship with Bythinella, but the p-distances between it and the other clades, within the range 9.3–12.5%, suggest rather a distinct genus.
The genetic variability parameters for all clades and mOTUs are shown in Tables 4 and 5. The most numerously represented clades A (191 sequences) and H (160 sequences) were chosen for detailed analysis and comparison between the genetically slightly diverse clade A and highly diverse clade H. Within clade A p-distance equalled 0.015, within H – 0.033 (Table 3). Within clade A π = 0.009, 30 haplotypes, in H π = 0.032, 57 haplotypes (Table 4).
In the COI-based tree for clade A (Fig. 166) Bythinella micherdzinskii is distinct (bootstrap 93%). All the other sequences form one big polytomy, the differences between the haplotypes are low. There are several groups of populations sharing the same haplotypes, like the one from the Polish Jura (with a few Slovakian ones), populations from the part of Austria and Germany, from the part of Hungary, the Czech Republic and Polish Żelazno, or from the part of Polish Tatra Mts., Austria, and Slovakia. The most diverse is the haplotype 25 from the population 15 from the Czech Republic. Among the other branches only three are better supported: (1) haplotype group 65 and 66 from south-central Slovakia and northern Hungary; (2) haplotype group 15, 60, 142, 220, 221 from the same region; (3) haplotype group 28, 29, 120 from Wisła and Krowiarki Pass in Poland, and from the western Czech Republic, the localities rather distant from each other.
The specimens belonging to clade A were collected at 74 localities, but only at eleven of them there were enough specimens for calculation of the genetic variability measures (Supplementary Table A.2). The number of haplotypes did not exceed three, π within the range 0.0011–0.0087. Between the populations within clade A, FST was rather high, thus Nm (M) rather low (Supplementary Table A.3). In numerous cases of the haplotypes shared between the localities, FST = 0, and Nm = ∞. In many others FST = 1, Nm = 0. In the remaining cases FST was high, usually above 0.7, and Nm low, and usually the higher values of FST were associated with higher geographic distance between the populations. A Mantel test confirmed the association of the FST values and the geographic distance (r = 0.1518, t = 2.4877, p random Z < observed Z = 0.9936), but 9999 random permutations estimated p = 0.4330, which did not confirm the statistical significance of the association. The latter may be a consequence of the matrix biased by numerous 0 and 1 values. There were similar results of the Mantel test for the association between p and geographic distances (r = 0.11394, t = 2.4313, p random Z < observed Z = 0.9925), but 9999 random permutations estimated p = 0.4826, the result biased by the numerous values p = 0. According to AMOVA, 86.16% of the variance was between the mOTUs, 12.54% between the populations within mOTUs, and only 1.31% within the populations. All the values were statistically significant.
Within clade H, likewise represented by many specimens, the picture was different. The differences between the haplotypes were high, and six groups of haplotypes could be distinguished within clade. The relationships between the specimens within clade analysed separately (Fig. 162) were somewhat different from the ones shown in the COI tree computed for all clades together (Fig. 161): mOTU 3 was not distinct, some of the haplotypes are close to the mOTUs 50 and 51, and two sequences form distinct branches, but not supported. Median joining showed marked differences between clades A and H. In clade H there are many haplotypes, differing in many substitutions and not represented by as many sequences as in clade A.
The representatives of clade H were from 49 populations; among them 15 were well-represented numerically and showed variability sufficient for the calculation of genetic variability measures (Supplementary Table A.4). The number of haplotypes did not surpass four, and π values were within the range 0.0011–0.0249. The high number of segregating sites, approaching 23 in some populations, was noteworthy, compared with maximum 6 in clade A (Supplementary Table A.2). Even though there were evidently distinct species within clade, the FST and Nm (M) values were calculated (Supplementary Table A.5). The values of FST were rather high, thus Nm (M) rather low. In a few cases only FST was below 0.05. The results of AMOVA were somewhat different from the ones for clade A. Only 68.6% of the variance was between the mOTUs, 24.71% between the populations within the mOTUs, and 6.69% within the populations. All the values were statistically significant.
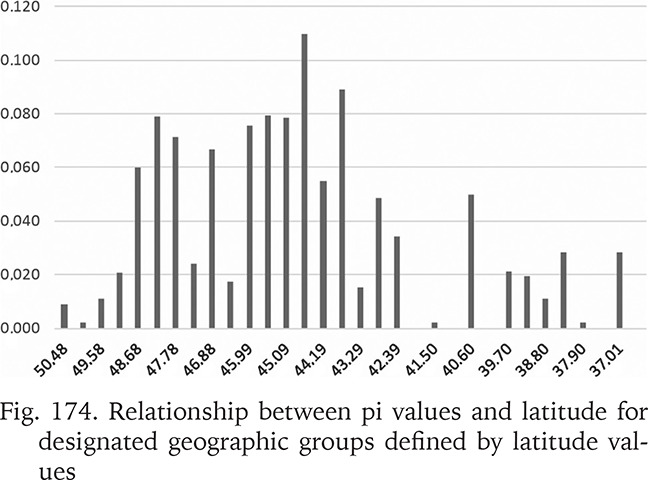
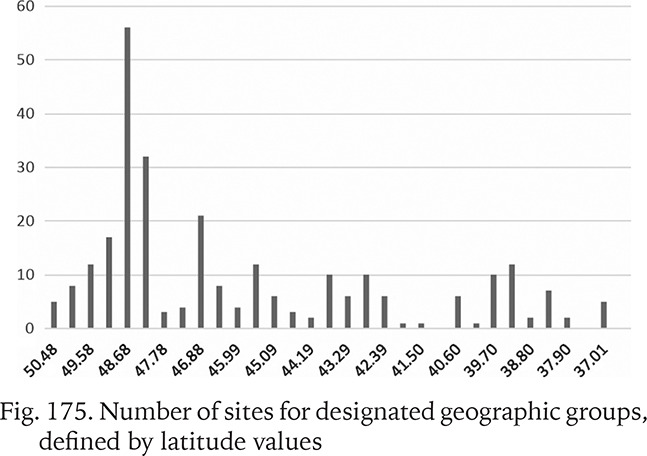
To test the association between the genetic variability measures and the geographic latitude and to minimise the influence of the longitudinal climatic gradient (oceanic vs continental climate), all the sequences from the Central Europe and the Balkans were used. The studied area was partitioned into 32 sections, each 50 km broad. Within a section π values were calculated for the populations pooled in that section (Fig. 174). The numbers of populations belonging to a section were also plotted (Fig. 175). The highest genetic variability was found between the latitude 44.19° and 43.29°, thus between the central Bosnia and Herzegovina and the line Mostar in Bosnia – Niš in Serbia. There was no correlation between π and the number of populations within a section.
Nuclear genes
92 sequences were obtained for each of the studied nuclear markers. The names of clades were the same as in the COI tree. 18S was the least diverse marker (Supplementary Fig. B.2). The sequences clustered in three groups. The first of them consisted of clade A and, surprisingly, one sequence from clade M. The second, different from the first (p = 0.008), grouped all the other sequences, with exception of clade L, most distinct (bootstrap support 81%), whose p-distance from the group first and second was 0.008 and 0.005, respectively. The distinctness of clade A, including the sequences of Bythinella dacica (clade M) was supported (70%).
Somewhat higher diversity was found in 28S (Supplementary Fig. B.3) and H3 (Supplementary Fig. B.4). In the 28S tree there was a distinct clade A, representing Bythinella austriaca (bootstrap 77%). In this clade in 28S and 18S tree also clustered another specimens from different clades: two specimens in clade I (Bosnia and Herzegovina) for 28S, and three specimens from clade M (Romania) for 18S. The distinctness of clade F was well marked, no worse than between clade A and the other clades, but clade is not homogenous. The differences between B. thermophila and B. pannonica within this clade are similar as those between the other clades. It is noteworthy that the sequences of clade I in the COI tree in the 28S tree cluster with clade A and within clade grouping nearly all the other sequences. Clade K from Albania, and clade L – B. serborientalis from Serbia are also distinct.
In the tree for the histone H3 (Supplementary Fig. B.4), a moderately supported (65%) branch was formed by B. robiciana, while all the other representatives of clade H (B. opaca and B. kapelana) were grouped in the other similarly supported (69%) clade, while B. luteola formed a well supported (73%) clade. All the sequences of clade A were identical, as with with the sequences from clades F and T, and some of clades I and M.
More diversity was found in the ITS1 (Supplementary Fig. B.5) and ITS2 (Supplementary Fig. B.6) trees. The tree computed for ITS1 (Supplementary Fig. B.5) confirmed the distinctness of clade A (B. austriaca: bootstrap 91%); within clade two Slovakian (Bansky Studenec) sequences form the sister clade to all the other ones. The high bootstrap value (97%) confirms the distinctness of the Hungarian/Slovakian clade F (B. pannonica and B. thermophila), as well as the distinctness of these two species from each other. Clade I from Bosnia and Herzegovina (B. magna, Bythinella sp. B1, Bythinella sp. B2) was similarly distinct (bootstrap 79%). The representatives of clades H, K and M were grouped together, but the bootstrap values were low. The topology of the ITS2 tree was simpler (Supplementary Fig. B.6). Clade T – single sequence from Albania – was sister one to the rest of the sequences (bootstrap 99%). All but two sequences from clade M formed the well supported (80%) clade, these two formed a distinct branch within the polytomy also including the other representatives of clade M, the Greek clade E, and the big clade (bootstrap 75%) grouping all the other sequences. Within the latter clade there was a clade (bootstrap 70%) clustering the representatives of clades H and I. Another group consisted of the representatives of A, K, and B. pannonica. The other representative of clade F – B. thermophilla – formed a distinct branch, similarly as clade L – B. serborientalis.
The tree computed for all the five nuclear markers (Supplementary Fig. B.7) shows a pattern similar to the one based on the COI, and the deepest nodes were unsupported, thus the deep phylogeny reconstructions remain impossible. All but two sequences from clade A formed clade with the bootstrap support 95%. With these two sequences the complete clade A is well supported (82%) as well. The 95% bootstrap supported clade F (B. pannonica and B. thermophila). High bootstrap supports were also computed for B. robiciana (95%), B. samecana (91%) and B. luteola (83%). The p-distance between clades were within the range 0.007–0.026 (Table 3).
Cytochrome c oxidase and nuclear genes
The tree computed on the concatenated sequences of all the six markers (Fig. 13) are rather like the one computed for the COI alone (Fig. 161), although the nuclear markers were accessible for far fewer specimens. The species delimitation resulted in the same mOTUs as in the COI tree, except that clade I did not form a monophyletic group in this tree. The single sequence establishing clade T was again the sister taxon to all the other sequences (bootstrap 99%). Similarly, high bootstrap (99%) supported clades A, E, F, H, K and L, and 89% - clade M. Clades A, E, I and K form a well supported clade (bootstrap 76%), sister to the one clustering clades K, J and M.
DISCUSSION
MORPHOLOGY
The shells of Bythinella lack any characteristic features and present a set of characters known as plesiomorphic for the Truncatelloidea (Hershler & Ponder 1998). Our images, as well as the PCA, show wide variability and much overlap among clades. Despite some morphological distinctness of the molecularly defined clades, it is clear that distinguishing or simply determining most of the species with the shell characters alone is impossible. This is rather common in the Truncatelloidea (e.g., Wilke & Falniowski 2001, Falniowski et al. 2012a, 2021, Szarowska & Falniowski 2014, Osikowski et al. 2016). Thus, the numerous descriptions of new species in Bythinella based on the shell only (e.g., Wagner 1941, Radoman 1976, 1985, Reischütz et al. 2008, Glöer & Reuselaars 2020: twelve new species, Glöer & Hirschfelder 2020: nine new species) must rise doubts. Although Bythinella reproduces the year round (Szarowska 1996), and the conditions in a spring are good enough throughout a year, they vary especially in light intensity, thus the primary production of the algae and other vegetation fluctuate, as does the temperature. Thus, the consecutive generations grow in various conditions, especially availability of food; hence, their growth varies, and some other shell characters also do not remain the same (e.g., Falniowski et al. 2012a). As a result, there are often at least two morphotypes in the same spring, genetically identical, but representing different generations. The morphostatic model of evolution, outlined briefly in the introduction, evidently holds for the Bythinella shells. The lack of the shell characters supporting taxonomical decisions (species distinctness and/or determination) does not dismiss the correlation between the ranges of the shell morphology and genetic diversity. The restricted size of the morphospace occupied by clade A correlates with the minimum number of haplotypes within this clade, contrary to the morphologically and genetically diverse clade H.
The radula was the first internal structure considered in the gastropod taxonomy. The main phylogenetic lines of the Gastropoda differ in their radulae (Purchon 1977, Fretter & Graham 1994), but the taenioglossate radula of Bythinella (Radoman 1973, 1976, Giusti & Pezzoli 1980, Falniowski 1990) is characteristic of nearly all the Caenogastropoda and there should be no more evident differences between species. Among the studied Bythinella the radula of B. robiciana is noteworthy, whose broad and massive, spade-like biggest cusps on the lateral teeth are an autapomorphy of the species and may reflect some special adaptation in the feeding, probably more efficient grasping of the fine particles from the hard substrate. Such teeth cannot be found in B. opaca living in sympatry with B. robiciana, which may present one more example of the reduction of niche overlap in sympatric Truncatelloidea, analogic as described in the brackishwater Hydrobiidae (Fenchel 1975a, 1975b, Hylleberg 1975, 1976, Lappalainen 1978).
The female reproductive organs and penes within clade A were described on the rich material by Falniowski (1987a) and Mazan (2000). Their wide variability was demonstrated, which rejects the descriptions of Boeters (1973, 1981, 1998), who believed that the shape of the bursa, for example, makes possible species determination in Bythinella. Also, the studies on Bythinella representing other clades (e.g., Giusti & Pezzoli 1977, Falniowski et al. 2009a, 2009c, Falniowski & Szarowska 2011) showed a similar picture. The variability is as wide, and the species distinction or determination is usually impossible with the female reproductive organs characters, and the penis morphology often supports only a little information in the taxonomy on the species level. These problems were summed up by Szarowska & Falniowski (2008) and Falniowski (2018). The variation reflects physiological processes, artefactual deformations caused by preservation, but at first seems not to be under any evident natural selection. Such variation may not relate to speciation.
In the present study the morphological variability was studied on the side, and few snails were dissected. The material was often not rich in specimens and/or not well fixed. The main task of these studies – nuclear acid sequences – forced the ethanol fixation of the material, which is not appropriate for anatomical study on the Truncatelloidea, where formalin should be used. However, our morphological observations were sufficient to show that the female reproductive organs character states do not reflect the molecular diversity. Again, the picture confirms a morphostatic model of evolution.
Falniowski (1989, 1990) demonstrated the constant differences in the length proportion of the tubular gland and the penis between Bithynia tentaculata (Linnaeus, 1758), B. leachii (Sheppard, 1823) and B. troscheli (Paasch, 1842). Later Glöer (2019) considered this proportion as distinguishing the species in Bythinella, which was confirmed neither in our study nor by Falniowski (1987a), Falniowski et al. (2009a), Falniowski & Szarowska (2011). The penes of the snails of clade F (B. pannonica and B. thermophila) were like the ones presented by Szarowska & Wilke (2004) and Glöer et al. (2015). Falniowski (1987a), Mazan (2000), Falniowski & Szarowska (2011) described vast variability of the penis in Bythinella. Falniowski (1987c) described B. zyvionteki different from all the other Polish species in its characteristic penis with broad and massive flagellum, but molecularly this taxon is identical with the other nominal species from the Polish Jura. Falniowski (2018) discussed the restrictions in application of the classic “lock-and-key” concept (Masly 2012) in this case: beside the functioning both arms it is hardly possible to expect any selective pressure. The characteristic, bi-armed penis of Bythinella is not complicated, there were no outgrowths, glandular arms, stylets, etc., and various levels of contraction caused by physiology and fixation, are the main source of variability. Morphostatic evolution is confirmed again.
PHYLOGEOGRAPHY AND MOLECULAR PHYLOGENY
The history of the genus Bythinella Moquin-Tandon, 1856 is too long to reconstruct a deep phylogeny. Even the nuclear markers are insufficient. The truncatelloidean fossil record is known back to the Lower Jurassic Thoarcian (Gründel 1999), 190 Million years ago (Ma), from marine habitats.
Radoman (1976) recorded sympatric occurrence of two species of Bythinella in one spring (the shell morphology was strikingly different in this case), and this was the only accepted case of sympatric occurrence of two Bythinella species for many years. Most probably it was the consequence of the somewhat dogmatic assumption that a small spring does not offer more than one niche, and that the Gause’s rule inevitably holds. Wilke et al. (2010) confirmed only two cases of sympatric occurrence of two Bythinella species in 173 studied springs. Falniowski et al. (2009b) and Falniowski & Szarowska (2011) demonstrated a few such cases. In our study we found sympatric occurrence of two mOTUs or even clades in as many as 16 springs, and even three in two springs, thus the sympatric occurrence of Bythinella species is not exceptional.
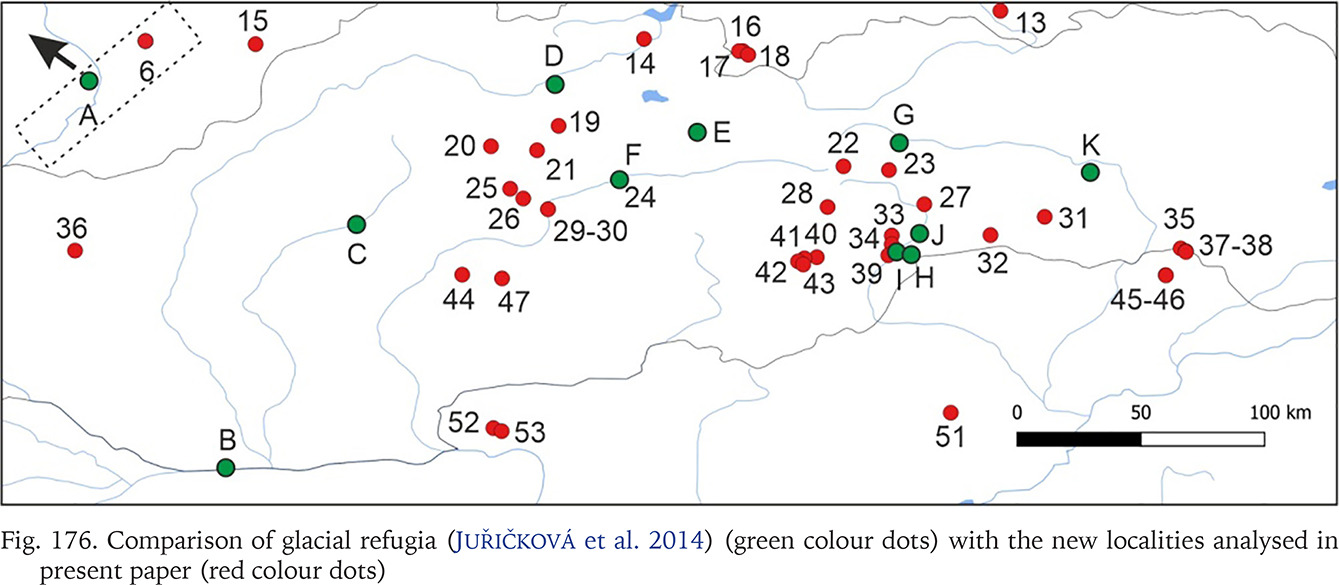
Many populations of Bythinella, especially the Polish ones, are young, established after the last glaciation. The oldest subfossil shells from Poland are 7,750±130 years old and were collected at Harcygrund near Czorsztyn, Pieniny Mts. (Alexandrowicz 1984). Benke et al. (2011) suggest (analysing the COI diversity) possible glacial refugia in Polish Tatra Mts. In Slovakia a few glacial refugia were demonstrated with radiocarbon dating: during the last glacial maximum (22,500–33,000 years ago) forests were present there (Juřičková et al. 2014), but no Bythinella were found. We compared the geographic location of the refugia and our localities (Fig. 176). Interestingly, at the localities 33, 34 and 39, two of them with B. austriaca and one with B. pannonica, there are six haplotypes together (p = 0.057), and these localities are close to the three refugia listed by Juřičková et al. (2014): 8 (H at our map) – Maštaľná Cave, 9 (I at our map) – Hámorská Cave, and 10 (J at our map) – the riverbank of Slaná River. The age of these radiocarbon dated shells of the typically forest snails was 9,643–9,292, 12,997–12,192 and 34,512–33,331 years, respectively. The haplotype diversity at this restricted area was 0.004, thus relatively high compared with 0.009 in all the wide range of B. austriaca. One of the haplotypes of B. austriaca and all three in B. pannonica were found only within these populations, which is noteworthy. All this may suggest association of this variability with the possible local refugia. The median joining network (Fig. 167) suggests that the divergence within clade A begun not long ago, because of invasion of specimens represented by 2–3 haplotypes, possibly from the local refugia.
Fig. 176
Comparison of glacial refugia (Juřičková et al. 2014) (green colour dots) with the new localities analysed in present paper (red colour dots)
There is a rich literature dealing with phylogeny and genetic structure of populations inhabiting springs, also considering snails (Colgan & Ponder 1994, Ponder et al. 1995, Falniowski et al. 1998, 1999, 2009b, Bohonak 1999, Bilton et al. 2001, Myers et al. 2001, Finston & Johnson 2004, Hershler & Liu 2004a, 2004b, Brändle et al. 2005, Hershler et al. 2005). Most of them stress a low gene flow which resulted in high levels of endemism in the spring snails (like Colgan & Ponder 1994, Ponder et al. 1995, Finston & Johnson 2004), but other studies present the widely geographically distributed species, showing higher levels of gene flow between populations (like Falniowski et al. 1998, 1999, Hershler et al. 2005, Falniowski & Szarowska 2011).
In Central Europe there are numerous small springs, with small, low fluctuating flow of water percolating through the fallen leaves, while in the Balkans there are numerous huge springs with enormous water outlet fluctuations. In small springs the values of Nm (evolutionary effective population size) are low. Such populations are particularly sensitive for random factors. Ponder et al. (1995) demonstrated higher differences between populations inhabiting neighbouring small springs than between the ones living in large springs, even those far apart from each other.
Haplotype diversity (Hd) informs about the numbers and frequencies of different alleles in a locus, independently of the sequences’ diversity. Nucleotide diversity (π) is weighted diversity of the sequences between the individuals within a population, independently of the different haplotype number (Avise 2000). These two parameters allow formulating hypotheses about the history of populations. Populations with low values of Hd and π were probably bottlenecked (stretching over time or rapid), or selective sweeping. High values of Hd and π may characterise evolutionary stable populations with long lasting high value of Ne (Avise 2000), or admixture of the representatives of other species, the latter may also result in low values of Hd coupled with high values of π. In the case of the studied Bythinella (assuming mOTUs as metapopulations) there is a picture of high Hd and low π values, which may reflect rapid growth of population from the ancestral one with low value of Ne, when there was enough time for recovery of the haplotype diversity through mutations, but still not enough for accumulation of higher sequence diversity. Perhaps all the Bythinella populations in Europe still bear signs of crisis, caused by the last glaciation.
High values of Tajima’s D (Tajima 1989a, 1989b, 1993), negative in three mOTUs (2 – B. austriaca, 6 – B. pannonica and mOTU 12 – populations from Austria, and Slovenia) may reflect the occurrence of numerous rare haplotypes, recent selective sweeping, and expansion of populations after a bottleneck not long ago. In the other four mOTUs (16 – from Greece, 17 – from Romania, 18 – from Austria and Slovenia and 19 – from Romania and Ukraine) positive values may reflect the occurrence of unnumerous rare haplotypes, balanced selection and recent range contraction. Tajima’s D test is known as the best to check selection and expansion of the population (Hartl & Clark 1997).
The median joining network shows clade A as a set of populations established not far ago, having short history, and most probably originated from a few specimens, invading successively, or from refugial populations, drastically bottlenecked, probably by the last glacial maximum. By contrast, in clade H the neighbour joining network reflects an undoubtedly long history of the populations representing clade – its range includes the Pleistocene glacial refugia (Apenine and Balkan: Hewitt 1996, 2000, Vogel et al. 1999, Petit et al. 2003, Schmitt 2007).
The value of FST grows in time, thus it may be used as a measure of genetic distance (Weir 1990, 1996). In some cases the FST values were negative. Obviously, the negative values cannot be interpreted biologically, it is erroneous value, the result of very unnumerous sample with high number of loci (each position in a sequence is interpreted as locus) (Gerlach et al. 2010). Such values are usually interpreted as equalling 0, but Gerlach et al. (2010) question such interpretation and recommend increase of the sample size. This is usually impossible, thus the conventional assumption of 0 values remains a solution. FST reflects selection, random factors, and mutations, thus not only the time and effectiveness of isolation. The analytic theory enables estimation of gene flow between populations, as Nm, number of migrants per generation. It must be noted that this is an estimate of the number of migrants which survived, adapted and were reproductively successful in a new population, which direct, telemetric techniques may not provide (e.g., Whitlock & McCauley 1999). The obviously serious restriction, especially common in clade A, is the same haplotype at many localities, resulting in FST = 0 and Nm = ∞, and we cannot distinguish between high gene flow, selection, founder effect or just chance. If Nm > 1 the haplotype frequencies in subpopulations remain homogenous (Wright 1931, 1969). If Nm < 1 but still positive, there holds a balance based on mutation frequency, migration, and genetic drift. As always in such studies, not all the Nm estimates of gene flow look realistic. Usually many of the assumptions of the model based on analytic theory are not met (Cockerham & Weir 1993, Slatkin 1993, Falniowski et al. 1998, 1999, 2002, Whitlock & McCauley 1999), especially if the specimen numbers per population are low. The curvilinear association between Nm (equalling M in our case, since we work on haplotypes) and FST results in small changes in value of one variable causing big changes in values of another one along the main part of the curve (Templeton 1998). Criticism of the Nm estimates does not negate its usefulness, especially since there is no other available. Sometimes there are high values between geographically distant populations, and this should be interpreted that it reflects similar genetic structure of these populations, not high gene flow between them. Endler (1977) stressed that the natural selection may result in either high genetic differences despite the high level of gene flow or imitate the gene flow. Random processes also affect the genetic structure of a population. Despite all the reservations, most of the Nm estimates seems reliable. As demonstrated by Wright (1969) and Crow & Kimura (1970), even a low gene flow, with just a few specimens exchanged in one generation, prevents higher genetic divergence between populations.
Falniowski et al. (1999) studied gene flow between populations of Bythinella belonging to our clade A, applying the frequencies of a few loci assayed with allozyme electrophoresis. They found statistically significant association of FST (θ) with geographic distance between populations and lack of such association for Nm. A Mantel test did not confirm such association in this case, although there could be listed numerous cases of high FST values between geographically distant populations as well as FST = 0 between geographically close populations. It must be noted, however, that there are many values of either 0 or 1 in the matrix of FST, which affect the results of permutations – many modifications of the matrix do not decrease the value of Z-statistics. Strikingly wide geographic ranges of some haplotypes also shape the general picture of interpopulation divergence.
Considering gene flow in Bythinella, especially the cases of high Nm between geographically distant populations, passive transportation, most probably by birds (Rees 1965, Wesselingh et al. 1999, Charalambidou & Santamaria 2002, Figuerola & Green 2002) cannot be overlooked. This would explain colonisation of springs as well as high Nm estimates between distant populations. Unfortunately, there are no data about such transportation in Bythinella, but there is a lot of such observations for other snails. Already Lyell (1832) mentioned the possibility of transport by waterfowl to distant islands for a land snail Succinea putris (Linnaeus, 1758) through the attachment of eggs to feathers, and Darwin (1859) observed ducks emerging from a pond with duckweed adhering to their backs. For the Truncatelloidea, Bondesen & Kaiser (1949) mentioned a possibility for Potamopyrgus antipodarum (Gray, 1843) and other prosobranchs of attaching themselves to feathers by trapping them between operculum and shell. Cadée (1988, 1994) observed living Peringia ulvae (Pennant, 1777) emerging from faeces of the shelduck Tadorna tadorna (Linnaeus, 1758), indicating that they survived the passage of the digestive tract. The numbers of Hydrobia observed alive in the shelduck’s faeces were considerable: three droppings contained in total 140 living specimens and 960 empty and/or broken Hydrobia shells (Cadée 1988). Falniowski (1987a, 1992) and Szarowska (2000) noticed relatively high resistance of Bythinella for desiccation, rather unexpected for an inhabitant of springs. This would also support the passive transportation by birds and, for short distances, also by wind (with fallen leaves), and in the hair of the wild boars visiting springs. The cases of most probably passive long-distance transportation of Bythinella, also over sea, are listed by Falniowski & Szarowska (2011).
TAXONOMY
The number of species within the Bythinella was estimated in the range 86–110, depending on the technique applied. Surely, these are only estimates, and they are based on molecular data. The most reliable techniques used – ABGD and ASAP – usually results in good primary estimates, but it may be biased by recent speciation events and high number of species. The estimates published so far are higher: above 132 (Yildirim et al. 2015) and over 250 (WoRMS Editorial Board 2021). The above numbers illustrate how difficult is to define a species within this genus. Molecular data are useful, but we must deal often with the “grey-zone” – the differences are not high, and the taxa are allopatric. Numerical techniques were applied, enabling separation of the mOTUs. Such procedures were applied earlier by Bichain et al. (2007a, 2007b) and Benke et al. (2011). The procedures extract potentially distinct species, but not always properly. The comparison of genetic distances between mOTUs may be also useful. Such a range between the species was estimated as 1.5–13.4% (Bichain et al. 2007b). Between the mOTUs distinguished the range is 1.6–16.0%, thus within a range estimated between the species in Bythinella. However, we note that the mtDNA phylogeny need not reflect the snail phylogeny. Such phenomena like introgression (e.g., Rysiewska et al. 2017) may result in mtDNA even identical in snails representing phylogenetically distant taxa.
Thus, definite distinction of a species must be biologically verified. Morphological data are not especially helpful in the case of morphostatic evolution in Bythinella. The classic species definition (Simpson 1961, Mayr 1969, 1974) assuming the reproductive community, cannot be applied for data deficient Bythinella. It must be noted as well that this concept works well in the cases which are obvious and does not include either parthenogenetic taxa or numerous cases of common interspecies hybridisation, demonstrated with molecular data. The phylogenetic concept (Wiley 1981), on the other hand, assumes common evolutionary history. This requires the knowledge about the necessary range of this community – how far and how much isolated should be an allopatric population to be recognised as a distinct species. The most efficient seems the concept of Templeton (1989), which provide the possibility of replacement of a population by another one, both within a species. In this case there is a risk of unrecognised displacement of a species by another one, thus a detailed knowledge of biology is necessary – such knowledge is lacking in Bythinella. Thus, the recognition of mOTUs as distinct species remains the only solution, although temporary.
The most numerously represented and geographically distributed clade A, with exception of one haplotype, represents Bythinella austriaca (Frauenfeld, 1857). B. ehrmanni Pax, 1938 (specimens from the type locality Żelazno near Kłodzko) are molecularly not distinct. The two nominal species described from Poland: B. zyvionteki Falniowski, 1987c (topotypes from Siedem Źródeł by Chechło) and B. metarubra Falniowski, 1987b (topotypes from Dolina Lejowa in Tatra Mts.) are also genetically indiscernible as well as B. steffeki from Slovakia (Grego & Glöer 2019). The morphological distinctness of B. metarubra may be interpreted as the result of dwarfism, caused either by hard conditions of life in a wet mountain meadow, or winter-born generation, at the localities where it occurred in sympatry with “normal”, bigger Bythinella. The case of B. zyvionteki remains different: the morphological differences, especially the characteristic habitus of the penis, are striking. Haase et al. (2007) showed that B. opaca (Gallenstein, 1848) is morphologically evidently distinct from B. robiciana (Clessin, 1890), but they are molecularly indistinguishable, stressing the necessity of integrative approach. This however still does not eliminate doubtful cases. Perhaps the analysis of bigger parts of genome would help in solving such problems in the future. Within clade A, the single sequence represents the topotype specimen of B. micherdzinskii, and the distinctness of this species was confirmed.
mOTU 59 in clade D represents B. turca Radoman, 1976, collected eight kilometres from its type locality.
From clade E (Greek but also including some populations from Bulgaria, Serbia, and Turkey) two newly sequenced snails from Attica belonged to mOTU 16, representing Bythinella charpentieri (Roth, 1855). mOTU 80, also within clade E, are the paratypes of B. walensae Falniowski, Hofman et Rysiewska, 2016. The identification of the other Greek species is doubtful (Falniowski & Szarowska 2011, Szarowska et al. 2016a). mOTU 79 from Crete probably represents B. cretensis Schütt, 1980, the snails were collected 2–3 km from Mesa Potami, the type locality of this species. mOTU 77 from Chios Island represents B. kosensis Schütt, 1980 (the island listed as a part of the range of the species in its description). The identification of the other Greek mOTUs is impossible. Glöer & Reuselaars (2020) listed 21 nominal species inhabiting Greece, 12 new for science among them, all based on the shell only. Similarly, Glöer & Hirschfelder (2020) described nine new species from Peloponnisos and Kithira, basing on the shell again. It is hard to find any rational basis for such description. mOTU 70 from Serbia are paratypes of B. nonveilleri Glöer, 2008, thus the distinctness of this species seems confirmed. mOTU from Bulgaria is B. hansboetersi Glöer et Pešić, 2006. Falniowski et al. (2012b) listed several the Bulgarian nominal species of Bythinella as younger synonyms mostly of B. hansboetersi. mOTU 73 from Bulgaria represents B. stoychevae Georgiev, 2011. mOTU 46 from Turkey most probably may be identified with B. magdalenae Yıldırım, Kebapçı et Koca, 2015, since it was collected 60 km from the type locality of that species.
Within clade F, mOTU 15 represents Bythinella thermophila Glöer, Varga et Mrkvicka, 2015, and mOTU 6 – B. pannonica (Frauenfeld, 1865).
Within clade H mOTU 12 represents Bythinella robiciana (Clessin, 1890), mOTU 3 – B. opaca (M. von Gallenstein, 1848). For the latter, the younger synonym B. schmidti (Küster, 1852) is often used in the literature. mOTU 20 represents B. angelitae Haase, Wilke et Mildner, 2007. In the mOTU 18 there were classified the snails with minute and rather characteristically shaped shells (Figs 51–52). Similar sequences to the ones from the mOTU 18 are published in GenBank as „Bythinella schmidti”, but such assignment cannot be accepted. As molecularly and morphologically distinct from any Bythinella in this region they were signed sp. S1, and they would be described as a species new for the science.
Within clade I, mOTU 4 was identified as Bythinella magna Radoman, 1976. Our sequences of mOTU 4 were identical with the ones from GenBank from the spring Klanac, the type locality of this species. The spring is located in Bosnia and Herzegovina, not in Croatia as erroneously written by Benke et al. (2009). They were also identical with the ones of B. kapelana Radoman, 1976 from Majerovo vrelo, the type locality of the species (Bosnia and Herzegovina, also erroneously located in Croatia by Benke et al. (2009)). It is noteworthy that these two localities are only three kilometres distant one from the other (Radoman 1983). These two nominal species are thus molecularly identical, and a giant shell of B. magna may be a consequence of either exceptionally good condition in the spring or parasitic gigantism. The description of B. magna is published above the one of B. kapelana in Radoman (1976: p. 141), thus the proper name is B. magna (priority rule, ICZN), and B. kapelana becomes a younger synonym. mOTU 5 and mOTU 13, both from Bosnia and Herzegovina, cannot be identified with any nominal species, are most probably distinct species, signed as sp. B1 and sp. B2, respectively.
Within clade K there were four mOTUs: 8, 9 and 14 from Bosnia and Herzegovina, and 10 from Albania (only one specimen in damaged shell – potentially a new species A1). The identification of the three mOTUs from Bosnia and Herzegovina was doubtful.
mOTU 8 was identified as Bythinella cf. luteola Radoman, 1976, whose type locality was only about 40–60 km distant from the ones of mOTU 8, and whose shells were similar; the shell variation (Figs 78–82) in mOTU 8 was noteworthy. mOTU 9 was putatively identified with B. cf. dispersa Radoman, 1976, and mOTU 14 as sp. B3.
Within clade L, mOTU 68, are three paratypes of Bythinella taraensis Glöer et Pešić, 2010. However, within this mOTU there also clustered two specimens from the type series of B. pesterica Glöer, 2008. Another paratype of B. pesterica formed the distinct mOTU 69. Two different species even in a type series of a species is perhaps the best illustration of the total uselessness of a shell in species distinction within a morphostatically evolving group. The shell morphology and geographic localisation suggested identification of the mOTU 7 with B. serborientalis Radoman, 1978. Recently, a new species belonging to this clade was described (Falniowski et al. 2023).
Within the Romanian clade M, two mOTUs (mOTU 1 and mOTU 17) represent Bythinella dacica Grossu, 1946, the third one (mOTU 19) – B. viseuiana Falniowski, Szarowska & Sirbu, 2009a.
Clade T is represented by a single specimen from Albania, thus its anatomy remains unknown; the shell is typical of Bythinella. On the other hand, it forms a sister clade to all the other Bythinella studied so far, and the genetic distances between it and the other Bythinella (p-distance) are within the range 9.3–12.5%, approaching the ones between the truncatelloid genera. Nothing more can be established without some more specimens.
SUPPLEMENTARY MATERIALS
Supplementary figures (Figs B.1–B.7) and tables (A.1–A.5) are available at https://doi.org/10.12657/folmal.033.001.